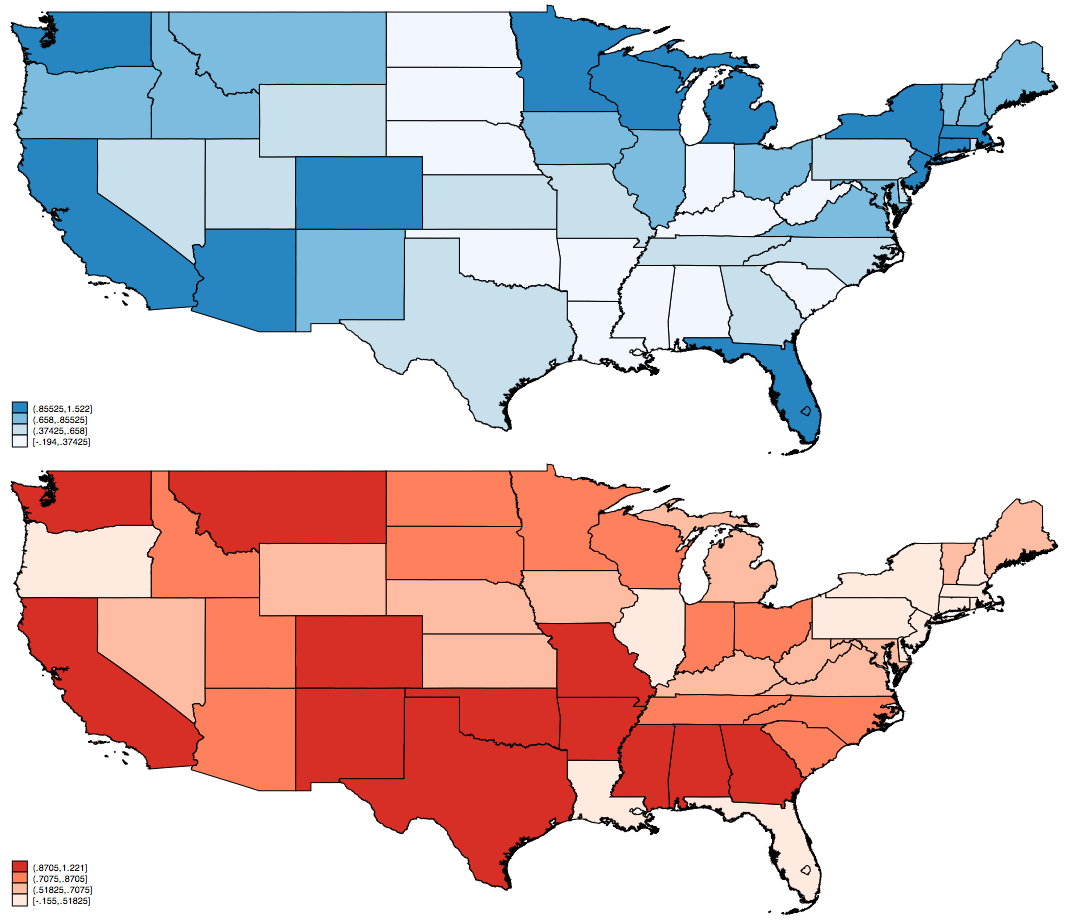
Seth Masket constructs the above maps, which show the median ideological score for state legislators (darker states are more extreme), taken from what he calls “one of the most important datasets on state politics, legislatures, and parties to be released in a long, long time”:
[T]hese graphs don’t really tell us why a state might have extreme or moderate legislators. The Republican parties of the deep South are probably very conservative because they represent some of the most conservative voters in the country, while the extremism of parties in more moderate states may be more an indicator of the strength of party organizations in screening out moderates in primary elections.
Still, this sort of data is extremely useful if we want to understand the political context of a state party and the politicians who emerge from it. Barack Obama was an Illinois state senator (yep, he’s in the dataset — ideal point of -.695), although they’re far from the most liberal group of Democrats in the country. George W. Bush got along famously well with Texas Democrats when he was governor, but those are among the most conservative Democrats in the land. How has Chris Christie survived in blue New Jersey? Well it probably helps that his state’s Republicans are moderate by national standards, keeping pressure off him to veer rightward.
