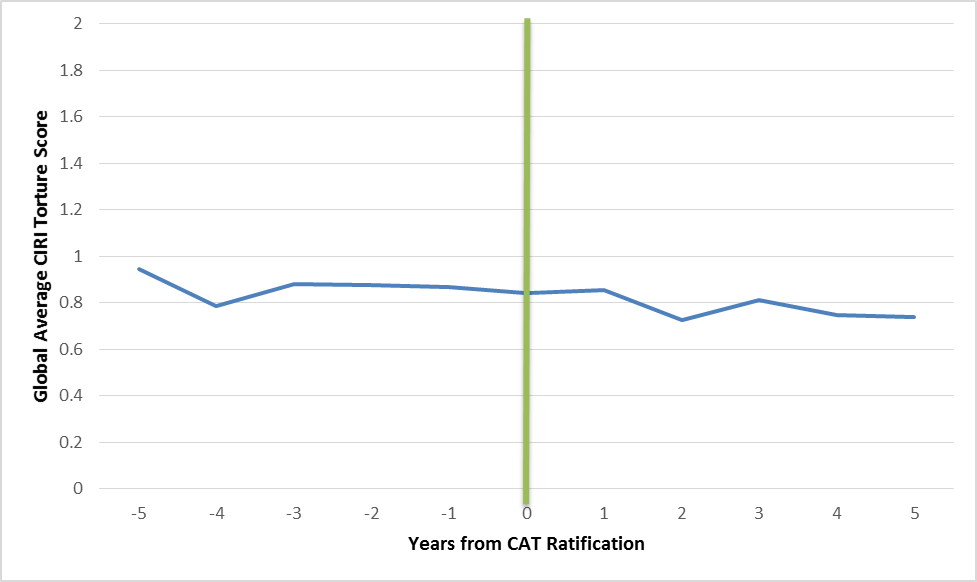
Eric Posner, writing at his new blog, presents a depressing graph on the effects of the Convention Against Torture:
The line shows the average torture score for countries during the five years leading up to ratification and the five years following ratification (where 0 refers to frequent torture and 2 refers to no torture). If the average country had reduced torture during this period, then the line would have sloped up.
But in this period, America became a torture camp on a hill, just as the Founders dreamed it would be.
