Chart Of The Day

Reddit Fuck

Someone data-mapped every use of the word “fuck” on Reddit over an eight-hour period:

Appropriately titled The F Word, the visualization was created by user “codevinsky,” who mined all the fucking data on Monday and wrote the visualization [Tuesday], June 10. He broke it out into multiple categories, allowing you to toggle between instances when “fuck” was coupled to another word (All of the Fucks), and when “fuck” stood alone (Single Fucks). … All told, users said “fuck” or some variation thereof 25,203 times. Which doesn’t strike me as all that staggering. If anything, I’m surprised that figure isn’t actually much higher.

Interactive version of the above graphic here.

Chart Of The Day

dish_cotdsatnight

A new YouGov poll shows that Americans consider themselves fun drunks. But what about the next morning?

On the whole, most Americans have avoided double hangovers where you feel bad both due to excessive drinking and because of something stupid or mean you did the night before. 26% of Americans say that they have never been drunk, while out of the 71% who say that they have been drunk before most (42% of the entire country) haven’t had to apologize for something they’ve done the night before. Only 31% have had to apologize for the night before. 23% of Americans say that they’ve had to apologize for doing something that they were too drunk to even remember doing.

Chart Of The Day

Gangnam Style

“Gangnam Style” passed two billion views this week. The Economist puts in perspective the time spent watching the music video:

At 4:12 minutes, that equates to more than 140m hours, or more than 16,000 years. What other achievements were forgone in the time spent watching a sideways shuffle and air lasso?

Chart Of The Day

by Patrick Appel

Prison Admission Rate

Keith Humphreys is struck by the rapid decline of America’s prison admission rate:

The shape of the curve is singular. Initially the rate continues its decades-long ascent. But in 2006 it hits an invisible ceiling and begins plummeting with increasing speed. This is an unusual finding in public policy analysis. Particularly at the national level, it usually takes awhile for major policy changes to be consolidated. But in this case, we have experienced an unambiguous U-turn. Further, while the 2007 and 2008 drops in the rate of prison admission are roughly equal in size, from that point forward the drop each year exceeds that of the prior year. The drop in 2012 was about double that of 2010, four times that of 2009 and six times that of 2008.

He adds that “you rarely see national policy go so vigorously in one direction and then abruptly travel with accelerating speed in the opposite direction.”

Chart Of The Day

Global Poverty

Sarah Dykstra, Charles Kenny and Justin Sandefur explain the overnight change in global poverty levels:

Global poverty numbers involve two sets of data: national income and consumption surveys (collated in the World Bank’s PovcalNet) and international data about prices around the world.   The [International Comparison Program (ICP)] is in charge of this second set of data.  It compares what people buy and at what local currency price they buy those things to come up with a ‘purchasing power parity’ exchange rate, a ratio that is designed to equalize the power of a rupee to buy what Indians buy with the power of a dollar to buy what an American buys.  Tuesday [last week], the ICP released their estimates for what those purchasing power exchange rates looked like in 2011.

In short, the new PPP numbers suggest a lot of poor countries are richer than we thought.

China’s improved PPP numbers got the most attention last week, but the change is much bigger than that:

India’s 2011 current GDP PPP per capita from the World Bank World Development Indicators is $3,677.  The new ICP number: $4,735.  Bangladesh’s 2011 GDP PPP per capita according to the WDI is $1,733; the ICP suggests that number should be $2,800. Nigeria goes from $2,485 to $3,146.

Dylan Matthews takes a closer look at the data:

The reasons the rate fell so dramatically are fairly technical. To figure out what $1.25 a day means in different countries, economists generally compare the price of a “basket” of goods across those countries. The results they get are thus pretty sensitive to the point in time when you compare baskets. The old data used a comparison from 2005; the new one is from 2011.

Basically, the World Bank found that prices of goods included in the basket were lower than the extrapolation from 2005 data had predicted they would be.

He adds some caveats about the quality of this data. Another important point:

[T]he biggest reason not to get too excited is that the 8.5 percent of the world that’s no longer counted as poor by this metric is still, by any objective measure, not faring well at all. “The people who have just been classified as ‘not absolutely poor’ don’t actually have any more money than they did yesterday, and will still struggle in terms of getting a decent job,” Dykstra, Kenny, and Sandefur note, “Many still face grim daily tradeoffs between buying school supplies or ensuring their kids are well nourished.”

Chart Of The Day

silver-index-racial-92

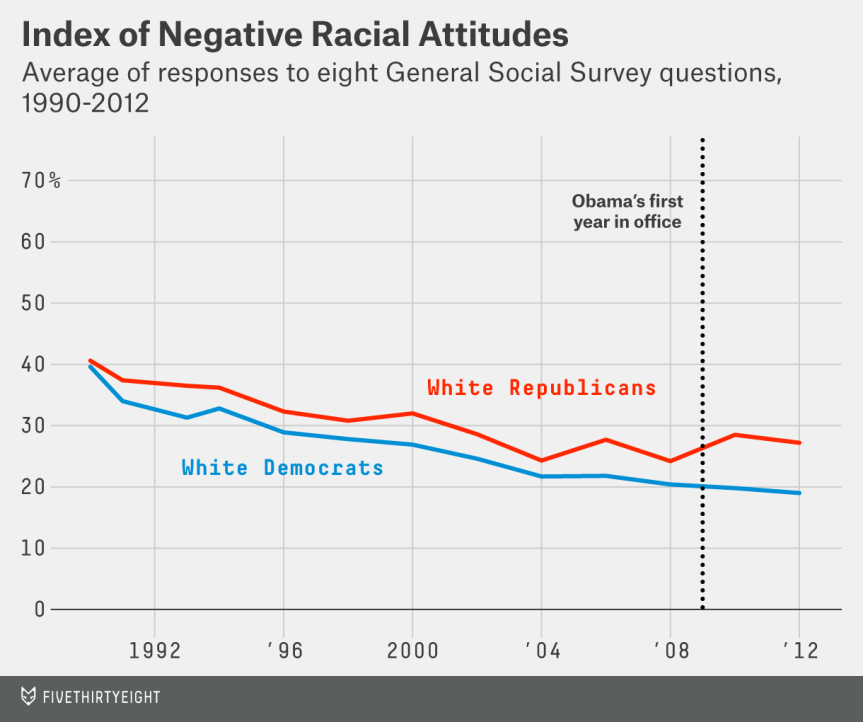
So yes, there does seem to be a slight partisan aspect to racist attitudes in the Obama era. But it is not that big, and the general trend lines over the longer term are positive. What I’m grappling with is whether my own confirmation bias is blinding me to the persistence of truly base racism in American society. I can remember only two instances in my adult life when someone said something to me foully racist. One was when someone observed that in Provincetown, there was no crime because “there aren’t any blacks.” I ended that conversation at that point. Another was a long-ago one-night-stand which in the end lasted only a few minutes. We were back in this dude’s apartment and he was cussing the cable service he had. Then he started going off on the African-American men who had installed it. “Worthless niggers,” he said in a tone that stopped me dead. I left.

I remember those moments because they were so rare. But then I went to Harvard, a bastion of anti-racist liberalism, and live in a still-largely African-American city in what remains a very racially mixed neighborhood and over the years have obviously selected racists out of my life. No, I’m not saying racism is exhausted by the kinds of vile things I heard, and obviously milder forms can be much more pervasive (even in my own consciousness). What I’m saying is that I have been actually shocked by the baldness of Donald Sterling’s bigotry – and perhaps I shouldn’t be. Charles Blow has an excellent column today, unpacking its evil. One aspect:

Stiviano asks, “Do you know that I’m mixed?” Sterling responds, “No, I don’t know that.” She insists, “You know that I’m mixed.” Later he tells her, “You’re supposed to be a delicate white or a delicate Latina girl.”

The word “delicate” there hangs in the air like the smell of rotting flesh, because by omission and comparatively, it suggests that black women, or women who associate with black men, are somehow divested of their delicateness, which in this case, and the recess of this distorted mind, sounds a lot like a term of art for femininity, and by extension womanhood. This is a disturbing peek at the intersection of racism, misogyny and privilege. “I wish I could change the color of my skin,” Stiviano says. Sterling responds, “That’s not the issue.” He continues, “The issue is we don’t have to broadcast everything.”

Another disadvantage I have in grasping all this is that I wasn’t born in America and didn’t grow up here – and so the contours of America’s long and hideous conversation about race are not in my bones. All I can say is: I’m trying to fit all the new data points in my worldview, and haven’t reached a conclusion. Oh, and Ta-Nehisi could not have invented a series of revelations more likely to prove him right about the lingering power of white supremacy, in the shadows of our lives.

Chart Of The Day

Religious Breakdown

Emma Green flags a new Brookings report that notes the growing numbers of religious progressives in America:

Blacks, hispanics, and people of mixed race are all more likely to be religious progressives than conservatives; these groups are also among the fastest-growing demographics in the United States. Similarly, Millennials are more than twice as likely to be religious progressives than religious conservatives; in fact, people older than 50 make up more than 60 percent of those who are considered to be religious conservatives. Although it’s impossible to talk to an 18-year-old about her views on culture and predict what she’ll think in two decades, these demographic trends suggest that the religious right is about to start shrinking.

But the question of influence is a little fuzzier. Although more than a third of Millennials are considered religious progressives, roughly 40 percent don’t have any faith at all: A growing number of young people don’t identify with a particular religion. That, along with the fact that an overwhelming majority of religious progressives don’t see religion as “the most important thing in their life,” suggests that faith is losing its overall influence over how people think about social and cultural issues.

This has, it seems to me, some salience when it comes to the question of religious freedom. What about the religious freedom of those who are pro-gay as a function of their faith? Are they not penalized by the law in North Carolina that bans marriage equality and also makes it a misdemeanor to perform a gay wedding not backed by the law? Of course they are:

“By preventing our same-sex congregants from forming their own families, the North Carolina ban on same-sex marriage burdens my ability and the ability of my congregation to form a faith community of our choosing consistent with the principles of our faith,” said the Rev. Nancy Petty, pastor of Pullen Memorial Baptist Church in Raleigh, who joined the lawsuit. As part of the state ban, it is a Class 1 misdemeanor for a minister to perform a marriage ceremony for a couple that hasn’t obtained a civil marriage license. In addition, the law allows anyone to sue the minister who performs a marriage ceremony without a license.

Gay leftist Mark Joseph Stern demands those defending religious freedom defend the progressives’ religious freedom as well. Very happy to. Even Ponnuru wants the ban on unlicensed marriages to be repealed. The more general point is that the assumption that religious convictions are solely behind banning marriage equality is empirically false. Religious liberty cuts all sorts of ways – and we shouldn’t pick or choose between one church and another.

Chart Of The Day

Curse Words

Mona Chalabi looks at childhood profanity:

study published last year in the American Journal of Psychology collected “data about the emergence of adult like swearing in children.” … The study found that, overall, boys had a slightly larger repertoire of bad words than girls (95 compared to 80). But that repertoire varied by age. By age 3 or 4, girls were using 40 taboo words while boys were using 34; but among 7- and 8-year-olds, boys were using 45, and the number of bad words girls were using slipped down to 25.

Chart Of The Day

Spending Support

Larry Bartels highlights the fact “that rich and poor Americans disagree about government spending to an extent virtually unmatched elsewhere in the world.”:

In 2006, just before the onset of the Great Recession, the International Social Survey Programme (ISSP) asked people in 33 countries about “some things the government might do for the economy.” In the United States, 63 percent of the respondents favored (or strongly favored) “cuts in government spending” to boost the economy, while only 13 percent opposed (or strongly opposed) such cuts. But that was not so unusual; in 15 other affluent democracies, an average of 57 percent of the respondents favored cuts in government spending.

What is much more remarkable about the pattern of opinion in the United States is the extent to which it was polarized along class lines.