Chart Of The Day

Climate Opinion

Sadly, America is home to far more climate skeptics than the global average:

According to Pew, 40 percent of Americans call climate change a “major threat.” The people most concerned about climate change are the Greeks, 87 percent of whom call it a major threat; so do 85 percent of South Koreans, 76 percent of Brazilians and 74 percent of Lebanese. The average, among the surveyed countries, is 54 percent.

Americans divide closely along partisan lines on the issue. According to Pew, only 22 percent of self-identified Republicans call climate change a major threat, but the number among self-identified Democrats is 55 percent, just above the survey’s global average. In comparative terms, Democrats are about as likely fear climate change as do Canadians and Germans; Republicans’ views are more akin to Egyptians or Israelis.

Chart Of The Day

Most Americans have no idea how serious hitting the debt ceiling would be:

debt ceiling

Jordan Weissmann comments:

Right now, most of the public seems to think that since Congress lacks any kind of spending restraint, it would be just fine for the Republicans to pick a debt ceiling fight, even if it means potentially defaulting on our debt. Would they still be fine with it if they realized it could result in their grandparents not receiving their social security checks? Who knows. Voters were much more closely split in a Washington Post/ABC News poll that framed the issue in terms of the government “paying its bills.” But the Republicans pushing for this confrontation are obviously aware that a good chunk of America is in their corner on this, whether those voters know what they’re talking about or not.

Chart Of The Day

UN Agreement

Erik Voeten looks at how the UN and the US have diverged:

The graph above plots the ideal points of the United States and the average ideal points of states in various regions of the world (as defined by the United Nations) based on their votes in the U.N. General Assembly. This is essentially the same thing as estimating how liberal or conservative senators are based on their votes in the Senate. …

The picture does not look pretty for the United States. There is a massive gap between this country and everyone else, and this gap seems to be widening steadily rather than closing. Obama may have moved a little bit toward the center of the space, but not much. And there is no evidence that other states have gravitated toward the U.S. position.

Chart Of The Day

civilwarchart

Rebecca Onion passes along the above chart, which “depicts major battles, troop losses, skirmishes, and other events in the American Civil War.” She focuses on a few parts:

A war is a complicated thing, and the chart has tried to track so many factors—geographical, political, and financial—that it’s easiest to concentrate on one or two of these at a time.

I noticed, for example, that the far left-hand column charts the decline in value of Confederate dollars, from one U.S. dollar in May 1861 to “nil” in April 1865, while the far right-hand column shows the decline in value of Union currency in relationship to gold, from $1 in February 1862 to $0.75 in April 1865. Perhaps the best way to approach such a chart is  to give up on complete “synoptical” understanding, and delight in those details.

A zoomable version of the graphic is here.

Chart Of The Day

Household Income

Neil Irwin passes along a depressing one:

This chart shows real median household income over the past 25 years; that is, the money earned, in inflation-adjusted dollars, by the family at the exact middle of the income distribution. … In 1989, the median American household made $51,681 in current dollars (the 2012 number, again, was $51,017). That means that 24 years ago, a middle class American family was making more than the a middle class family was making one year ago.

Chart Of The Day

Perhaps one of the more salient factors behind Rouhani’s new outreach to the US on nuclear development:

Screen Shot 2013-09-17 at 12.21.10 PM

The sanctions have worked, the Iranian economy is in free-fall, and the regime desperately needs a better relationship with the world as a result. If the account in Der Speigel about plans for opening up Fordo for international inspection is correct, then this underlying economic crisis helps reveal that this new opening is not a function of generosity for Iran, but of dire necessity. What we have to do is be patient, listen carefully, and hope.

Chart Of The Day

by Tracy R. Walsh

Nancy Duarte maps the rhetoric in the “I Have A Dream” speech:

duarte_MLK1

She writes:

Metaphors are a powerful literary device. In Dr. Martin Luther King Jr.’s “I Have a Dream” speech, about 20 percent of what he said was metaphorical. For example, he likened his lack of freedom to a bad check that America has given the Negro people … a check that has come back marked ‘insufficient funds.’” King introduced his metaphor three minutes into his 16-minute talk, and it was the first time the audience roared and clapped.

(Hat tip: Maria Bustillos)

Chart Of The Day

location vs class

Dylan Matthews explains the above chart on global inequality:

[C]lass rank matters far less than location in determining where someone falls in the global income distribution. That’s a big change from the 19th century, where class rank predominated. [Branko Milanovic, the lead economist at the World Bank’s research group] argues this means we live in a “non-Marxian world,” where the relevant cleavage is not between the proletariat and the owners of capital but between those with the misfortune to be born in poor countries and those with the great fortune not to be. “A proper analysis of global inequality today requires an empirical and mental shift from concerns with class to concerns with location,” he writes. “In other words, a movement ‘from proletarians to migrants.’”

Chart Of The Day

unemployment-vs-share

Ezra Klein declares that the comparison seen above “calls the entire economic recovery into question”:

[T]here are two ways to leave the ranks of the unemployed. One way — the good way — is to get a job. The other way is to stop looking for work, either because you’ve retired, or become discouraged, or begun working off the books. The yellow line on the left shows the official unemployment rate since 2008. It’s fallen from over 10 percent to under 8 percent. But the red line on the right shows the actual employment rate — that is, the percentage of working-age adults with jobs. What should scare you is that the red line has barely budged.

(Chart from the Center on Budget and Policy Priorities)

Chart Of The Day

Obamacare Costs

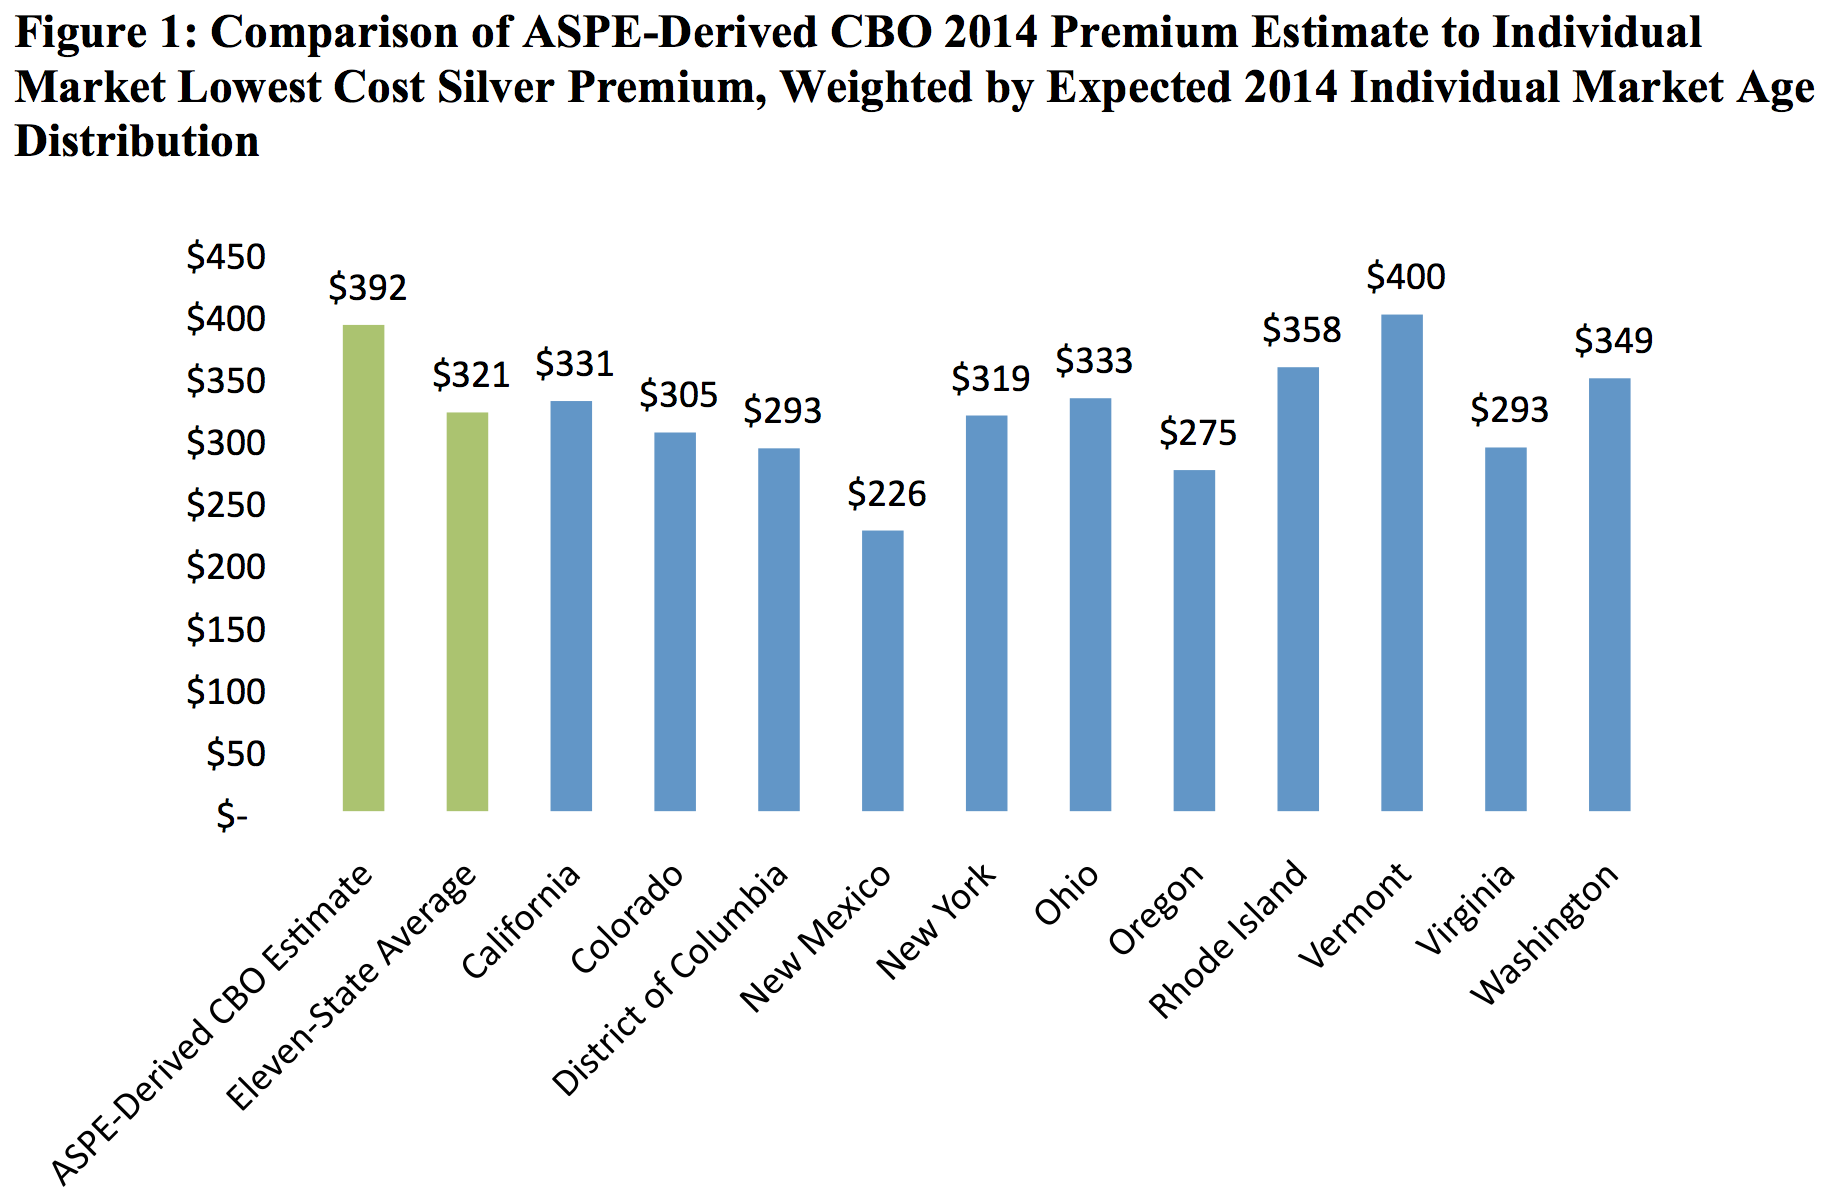
The above chart comes from an Assistant Secretary for Planning and Evaluation (ASPE) report (pdf) on Obamacare’s exchanges. The big finding:

In the eleven states for which data are available, the lowest cost silver plan in the individual market in 2014 is, on average, 18% less expensive than ASPE’s estimate of 2014 individual market premiums derived from CBO publications.

Sarah Kliff explains the chart:

What you’re looking at here shows what insurance plans will charge for coverage that will cover 70 percent of a typical subscriber’s health-care costs. These are averages of the second-lowest cost plans that provide this level of coverage (silver plans, as they’re known under the health-care law)

Jonathan Cohn considers why the premiums are coming in lower than expected:

The law’s critics and, by the way, quite a few insurance industry officials warned that premiums were going to exceed official expectations. The reason: Insurers couldn’t assume that young and healthy people would sign up for coverage. Without those customers, insurers would be left covering people who were predominantly older and sicker—and, as a result, more likely to run up big medical bills. In response, Obamacare’s defenders—or, more accurately, its believers—argued that the combination of subsidies and the individual mandate would be sufficient to entice enough young, healthy people. They also predicted that insurers, facing the prospect of losing customers to rivals, would opt to keep premiums relativley low.

For the moment, at least, the believers’ case looks pretty strong. A brand-new paper from the Robert Wood Johnson Foundation paper, prepared by Linda Blumberg and John Holahan the Urban Institute, may offer a clue why. The paper suggests that most people buying coverage on their own next year will be as healthy, if not healthier, than the typical person who today gets insurance though a job. Maybe the insurance industry’s own actuaries have, after looking carefully at the figures, come to the same conclusion.