
A reader from Minnesota insists that the polar vortex was actually not that bad – at least by Minnesota standards:
Our coldest temperature recorded a couple days ago was -23 degrees Fahrenheit. That’s plenty cold. But 50 years ago, Minneapolis winters regularly hit -30 degrees Fahrenheit. In the ’60s and ’70s, this occurred every three to four years. Today we have hit that mark only once since 1980, and there is a very clear trend towards less-extreme cold snaps. In fact, it used to be rare to have a winter that didn’t go below -20 degrees Fahrenheit, and now it’s the rule. So even this cold snap is evidence for global warming, because, frankly, they don’t make them like they used to.
The above graph, from the Minneapolis Star-Tribune, backs this reader up. Meanwhile, Gopnik notes that “strong scientific theories are, whatever we might like to think, more often counterintuitive than self-evident”:
We teach science, we talk science, as though it were the triumph of the self-evident over the obscure, the empirical over the occult. This is a good propaganda technique—“Just look with your own eyes!” we say—until it isn’t. Five hundred years after Copernicus, it sure still looks as if the sun is going around the earth. The evidence for global warming is not, or not primarily, experiential. It is cumulative, statistical, and inferential—just like the evidence for biological evolution, ever-improving I.Q.s, and the Higgs boson. Cold days don’t disprove it, and hot spells in summer don’t show it’s true either. It first has to be grasped as an abstract concept, albeit one with real and scary effects.
Another reader chimes in:
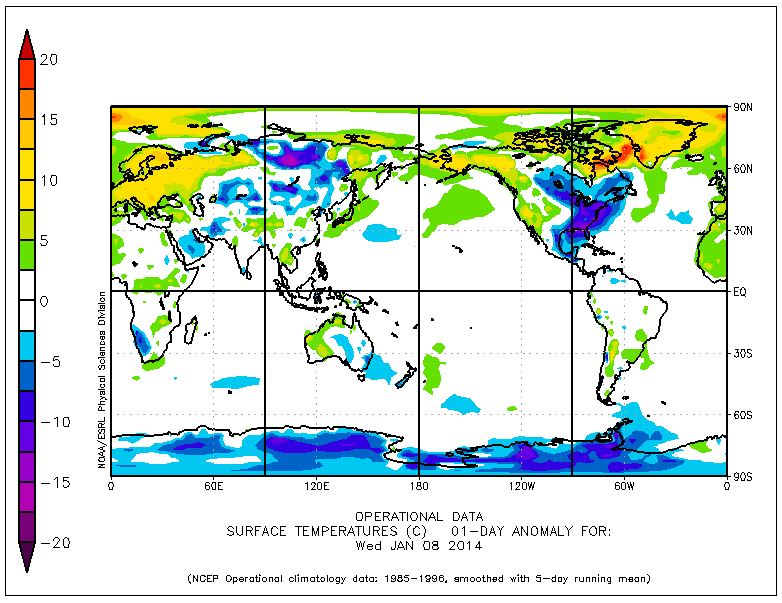
Check out this graphic for perspective on the relative global significance of the current East Coast “polar vortex”:
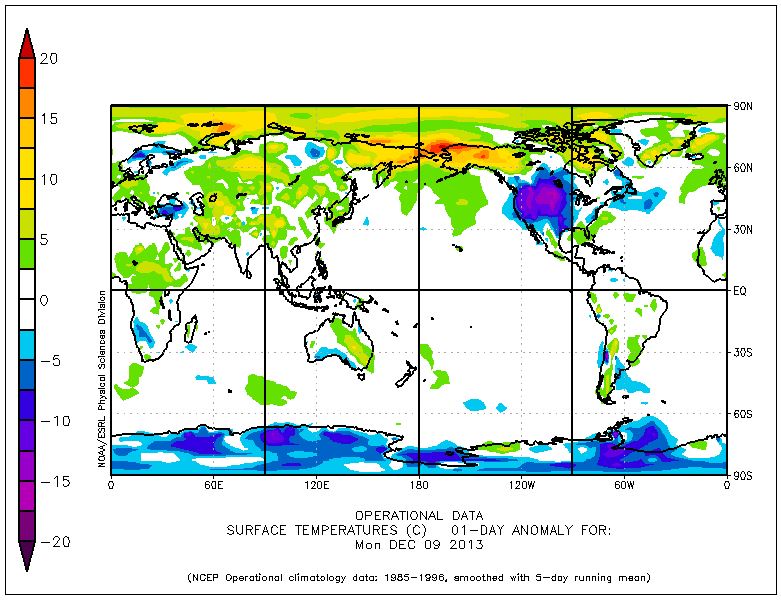
While half of North America and parts of Russia are in a deep freeze, a larger part of the Northern Hemisphere is experiencing significantly higher-than-normal temperatures. Below is another graphic showing the situation on December 9, 2013, the last time that North America experienced record lows:
The deniers on Fox and in Congress like to point to sub-freezing weather outside their windows as evidence that global warming is a myth, but looking at the complete picture tells a different story. Also, both images show that the Arctic, where it is winter, is abnormally warm, while the Antarctic, where it is summer, is abnormally cold. This is not an aberration; this has been typical of the weather for the several years that I’ve been following this graphic. If you check back in six months, you’ll see the exact opposite – a cold Arctic and warm Antarctic. These are not trivial temperature anomalies, either. It’s typical to see widespread areas at both poles where the anomaly exceeds 35 degrees Fahrenheit.
Of all the climate graphics I look at, this one, in my opinion, is the most convincing in demonstrating how much the climate has changed already.
The source of those two images is here. Another reader has a dispatch from the West:
I’m sorry that you’re having such cold weather, but there’s another issue you haven’t mentioned: California is having a severe drought. In fact, we’re in our third year of drought. If dry conditions continue, the so-called “Stage 5” drought restrictions – the most severe category – will likely come into effect in February. Some of the latest articles on this serious problem are here, here, here, here, and here. This may have serious repercussions not just for California but the nation. If you like your avocados, wine, pot, fruit, or any other California product, please pray that we get some big rain-producing storms!
