Not of the fist variety – though there are probably a lot of those going around:

Sam Wang measures it:
Since mid-December, President Obama’s net approve/disapprove numbers have shot up. This graph shows the median of the last 21 days of polling. The current level, a net disapproval of only 2%, reflects six pollsters (Gallup, Rasmussen, CNN, ARG, YouGov/Economist, and ABC/Post). These are his highest numbers since early 2013. What is going on?
He connects this uptick to Obama’s “newfound liberation from the pressures of the election cycle”
I’ll get out on a limb with a speculation: If this “real Obama” uptick lasts, it might demonstrate a benefit to Democrats if they act, with vigor, like Democrats. With a newly invigorated President and a Congress in full opposition, the coming year will be worth watching.
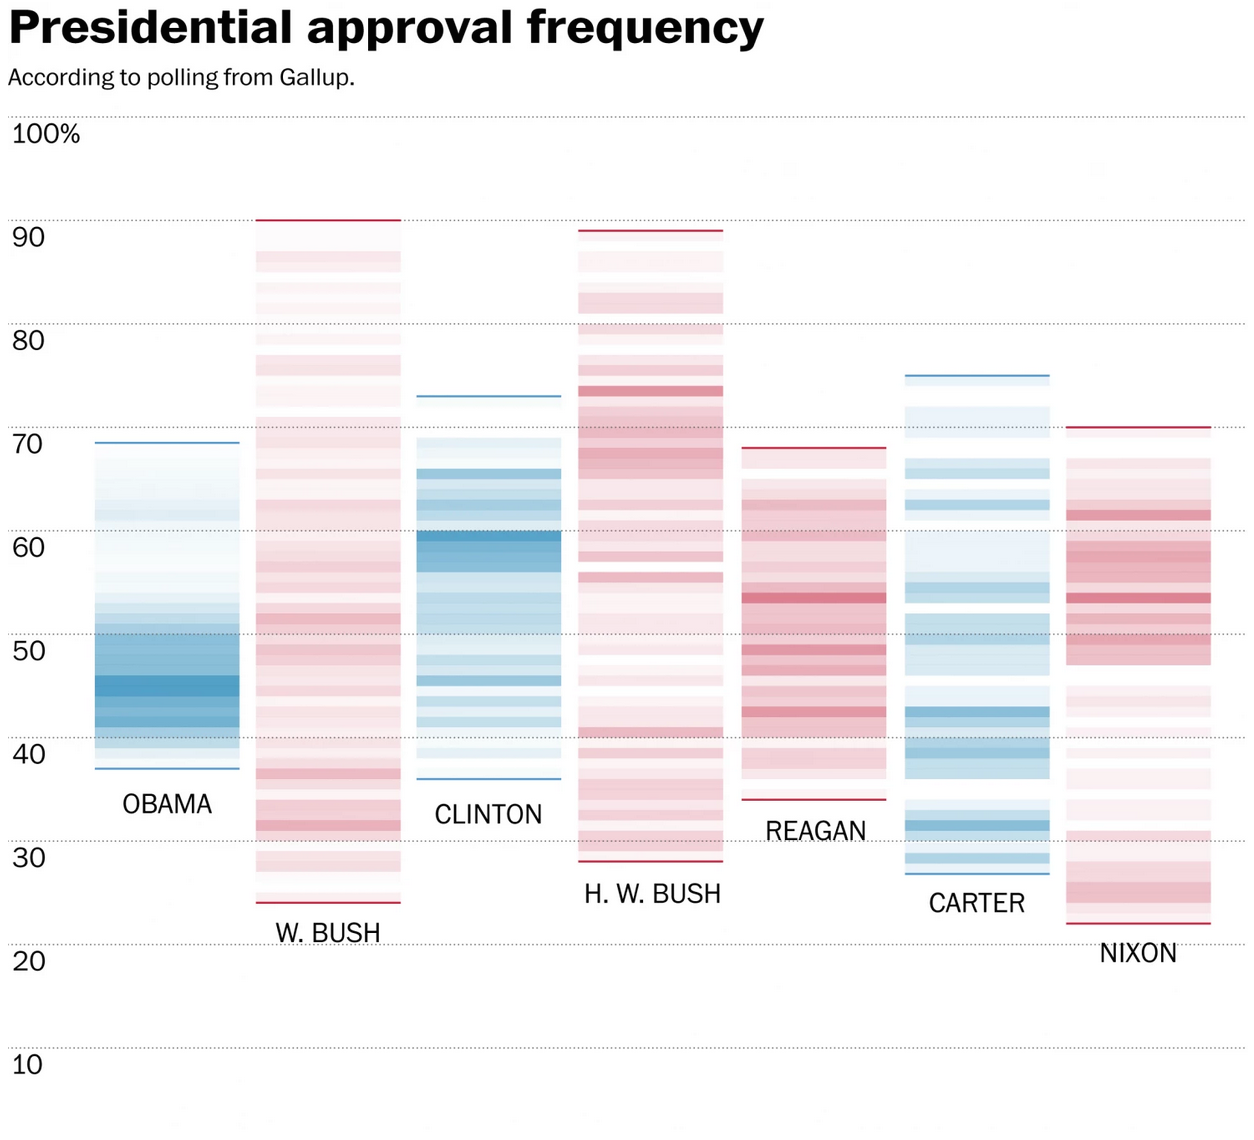
Meanwhile, Philip Bump notes that, “with the exception of a spike around the 2012 elections, President Obama’s approval rating has been unusually steady”:
If you look at the distribution of the most common approval ratings for presidents since Nixon (skipping Ford), you get a pattern that looks like this. The darker the bar, the more common that particular approval rating.
You’ll notice that the overall range of approvals for Obama has fallen in a fairly tight range — comparable to Presidents Reagan and Clinton. But that’s the total range. The most common approvals Obama has seen have been within a relatively narrow zone in the mid-40s.
He attributes this to consistent Republican disapproval:
By the end of his first year, Obama’s approval among Republicans had fallen to 16 percent; it’s rarely been above that since, settling into a general 7-15-point range. The fluctuations, then, have mostly been the result of Democrats embracing or ignoring the president — and independents getting more or less enthusiastic.
