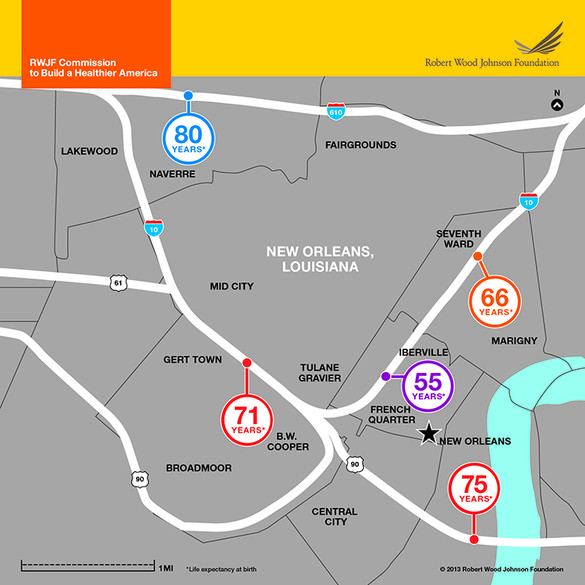
The End Of The Line

fig4_Health_DC_6a

The Robert Wood Johnson Foundation mapped life expectancy by subway public transit stop in five parts of the country (the above map depicts New Orleans), revealing health disparities:

“The maps are meant to show that this is a pervasive problem,” says director of the Virginia Commonwealth University Center on Society and Health, Steve Woolf, whose research has produced a number of similar maps independently. “You can do this in any American city–and many cities have done this and found the same pattern.”

The pattern mimics much of the disparities we see across social and economic inequalities–in areas with less access to educational resources, or decreased availability of safe areas to play or work out, lifespans tend to be shorter. Poverty, the proximity of highways and air filled with diesel fumes, and food deserts are also linked to poor health. Woolf points out that the maps are meant to demonstrate that environmental factors can have a bigger impact on our health outcomes than what happens inside a doctor’s office.

Update from a reader:

Just to be a nitpicky jerk, New Orleans does not have a subway system. We’ve got streetcars for the tourists, and buses for poor people. Also, that’s the least comprehensible map of New Orleans I’ve ever seen. I’ve lived and worked in the city for about 15 years, and I am having a hell of a time telling where those markers actually are. But yeah, the city certainly has a huge variety of economic disparity and no doubt huge amounts of health disparity follow that. Either way, with the huge amount of undoubtedly unhealthy but amazingly delicious food that this town offers; I’m surprised anybody here makes it past 60 before their heart gives up.

Where We Meet Our Mates

Douthat notes that fewer and fewer Americans are marrying fellow churchgoers or neighbors. More and more are meeting online:

[T]he data on unions formed online looks pretty encouraging, and it’s possible that the internet is helping to compensate for the eclipse of other forms of community, rather than contributing directly to those other forms’ eclipse.

But it seems fair to assume that there are still a lot of people who would prefer to meet their future spouse the old fashioned way — through initial flesh-and-blood encounters embedded in a larger pre-existing social network. If that’s your preference, the university campus is one of the few flesh-and-blood arenas that seems to be holding its own as a place to form lasting attachments.

Millman expands on the possible social consequences of widespread online dating:

The hidden costs of internet dating aren’t some much to the romantic “market” as to the rest of society. How many young people don’t go to church or synagogue because there’s no reason to go there to meet marital prospects? And once that dynamic starts, it inevitably accelerates, as the residual group who does show up is increasingly untenable romantically (because they are there for other reasons – or can’t find an “adequate” mate digitally). Then there’s the problem that if you meet someone digitally, you’re probably meeting someone with a distinct social circle – as opposed to someone from within your own social world. That’s good if the relationship doesn’t work out – less risk of collateral damage. But it creates complications if the relationship results in marriage, as now you have two circles to navigate that don’t overlap well. That happens plenty if you meet in meatspace, of course, but it’s much more certain to happen if you meet digitally than if you meet, say, at church.

The South vs Social Mobility, Ctd

Screen Shot 2013-07-22 at 11.20.59 AM

Several readers have voiced skepticism over our coverage of this map and the accompanying piece from the NYT:

I would be interested to see that map compared to a map of “chances anyone in this county is an earner in the top fifth.” Some parts of the country simply have no or very few opportunities that earn at those levels, so it should be no surprise that you find few people “rise” to that level – with the inverse true for places like NYC, SF and Seattle. To study mobility, unobscured by regional differences in wealth, one would need to re-calibrate to the quintiles within each county, rather than comparing local samples to national averages.

Another reader:

Quite clearly the map shows (and the original paper makes clear) the importance of race, whether that be African-American or Native American. But this does not mean that somehow the Red States only care about taking care of their “white, GOP brethren,” as one reader implied. What does the data (pdf) from the paper say? Check out Table 5. Two of the best negative correlations with intergenerational mobility are the county’s rate of divorce and its share of single moms – two things that disproportionately affect African-Americans and Native Americans.

Utah, meanwhile, confounds your “two Americas” reading. Look at the blue area in Utah in the map you posted. This is because of Mormonism. Check out this blog post, for an interesting discussion on the similarities between Utah and Denmark, two places of high intergenerational mobility.

Another goes into much more detail on the previous points:

The graphs you’re presenting from the New York Times article are HIGHLY misleading.

First off, they look at social mobility without taking into account the regional differences in cost of living. From the chart: “The top 5th is equal to family income of more than $70,000 for the child by age 30, or more than $100,000 by age 45.” Anyone who’s anyone knows that living on $70,000 per year income on the Upper West Side of Manhattan is vastly different than living on $70,000 per year in the rural South.  In one place you are “poor” and the other you can live like a king.  I’ll gladly earn $65,000 and live in Tuscaloosa, Alabama vs. earning $75,000 and living on the Upper West Side of Manhattan. Yet, in one case I haven’t reached the top 5% of income earners while the other I have.  This is clearly not true in reality.

Without a cost of living adjustment, the data is essentially meaningless. Income tells you next to nothing. What you can buy with that income is what matters! And that varies greatly by region. The chart essentially tells you where the dollar is worth more and where it is worth less.

Secondly, look at the people presented in the article as the “poor” struggling to attain a middle-class lifestyle. Stacey Calvin is presented as a “poor” person struggling to enter the middle class in suburban Atlanta. She has three kids. Is a single mom. Works only part time. Yet, from the picture of her, has the latest in smartphone technology, a three-bedroom home, and remote-control cable television. She and her kids are wearing fashionable clothing. This is NOT the picture of someone mired in poverty.

The next example is Michael Novajovsky, who is an educated network engineer.  He is married, three kids, has a beautiful house (as far as one can tell from the picture), earns $27/hour for a temporary job. From his Facebook page, you can see he isn’t mired in poverty either.

Lastly, how about breaking the data down by zip code or neighborhood.  New York City is not homogenous.  It includes Harlem, the Upper West Side, etc.  Simply aggregating numbers of very different neighborhoods as one is highly misleading.  Especially compared to a place like Atlanta that is spread much further about geographically.

Another:

I happen to live in Atlanta and recognize the difficulty in getting from the south side of the metro Atlanta area to where jobs are located to the north side of the metro Atlanta area if you rely on public  transportation. However, I respectfully submit citing the NYT article in support of your contention “the South” (which I guess does not include Red State/low-tax Texas by your assessment of the NYT map) seems at times to be a different country is cherry picking items from the story. As evidenced by the map itself, the NYT reporter stated “Climbing the income ladder occurs less often in the Southeast and industrial Midwest, the data shows, with the odds notably low in Atlanta, Charlotte, Memphis, Raleigh, Indianapolis, Cincinnati and Columbus.” Would be interested in your thoughts on why the same problem being present in the industrial Midwest fits with your interpretation of the article.

I think the map can bear many different interpretations. I focused on the obvious fact that race is a factor, and that the band in the South correlates very closely to slave-ownership patterns in the past. There may well be other explanations for other regions – but the Southern aspect is what immediately struck me, and, I’d say, anyone who looked at it. Update from a reader:

I wish you would stop saying that race explains the differences in social mobility found in the recent study.  The authors, in their summary of their findings (pdf), explicitly state that the differences remain after controlling for race.

Unfiltered feedback on our Facebook page.

Voter ID Laws Are A Bad Way To Steal An Election

Nate Cohn doubts that voter ID laws have major effects:

[T]here isn’t very much evidence that voter ID costs Democrats a large number of voters. Even the best studies are pretty weak, and we can point to states like Georgia and Indiana, where voter ID laws were enacted and Obama made unusually large gains. That doesn’t mean that voter-ID doesn’t help Republicans at all. Nor does it justify disenfranchising voters, no matter how few. And it’s possible that stricter laws, like the one under consideration in Texas, will have a larger impact. But to date, the consequences of voter-ID are nearly imperceptible.

In a follow-up, Cohn examines data from North Carolina:

Obama’s share of the vote in North Carolina might have dropped from 48.3 to 48 percent, expanding Romney’s margin of victory from 92,000 to about 120,000 votes. 25,000 to 30,000 votes could flip a very close election, but nothing more. In 2012, no state was so close. … If you want voter ID because you think you’ll steal Pennsylvania, or you’re opposed because you’re concerned it’s a Democratic apocalypse, move on. It’s not the apocalypse, even if it is an affront to voting rights.

Why Does Marijuana Prevent Diabetes And Obesity? Ctd

A reader adds anecdotal evidence to the research:

I’ve fought the weight battle my whole life.  Now I’m down 37 pounds and seem to be maintaining at that new level. One of the reasons is marijuana. I’ve dieted frequently over the last couple of decades but no matter what I did I couldn’t seem to push below 239. It was as if my body just said “Thus far, no further.” I was tired of losing the battle, and my doctor was warning that diabetes could be in my future, so I concluded that I needed to shake things up.  I began by swapping marijuana for alcohol.  I’m now at 223, no longer technically obese, though I could certainly lose a few more pounds.

What’s stranger, though, is how easily I’m maintaining at 223. In the past the regaining of weight began almost immediately post-diet. Yes, I’m being reasonably disciplined, but not very. I’m smoking a moderate amount of legal medical weed once a day, in the evening when the work is done and I know I won’t be driving – same rules I had for alcohol consumption.  So far so good.  Not only is my weight down but my pulse and blood pressure are those of a much younger, fitter man than I’ve ever been.  I almost feel as if I’m cheating.

No idea why it works.  But it seems to.

Update from a reader:

“No idea why it works”? I do. Not drinking is the easiest way to lose and keep weight off. I would argue it has nothing to do with he/she replaced it with. My four-pack turned into an eight-pack when I stopped drinking for a few months. I’m very fit and exercise regularly. Those last five pounds that I couldn’t lose before, gone. They creep back over time if I drink even though I’m not a big drinker, 1-2 drinks/per week. When people who see me with my shirt off ask how I did it I simply say I quit drinking. The most common reply is “oh, I could never do that”.

Another writes:

Your post on lower rates of obesity and diabetes in regular marijuana users doesn’t surprise me at all, especially since I have seen so many cases of cannabinoid hyperemesis syndrome (also known as the “anti-munchies”) in my patients over the last three years.  This condition is characterized by periodic cycles of abdominal pain and vomiting in frequent marijuana users, and many of them have had extensive and costly medical testing without any definitive results.

The only definitive relief comes from abstaining from cannabis, although there are several unusual features of the condition (patients state that their nausea and pain are relieved by hot showers or baths) that help in diagnosis.  The mechanism of this disorder may simply be due to the brain “pushing back” against a constant flood of cannabinoids in the blood, similarly to the way chronic alcoholics or opiate addicts will experience tolerance and then withdrawal to those particular drugs.  Not every regular marijuana user develops this condition, but perhaps increasing rates of the condition are contributing to an overall decrease in obesity rates in this population.

A doctor is skeptical of the research we posted:

In general, I get frustrated with general reporting of scientific data.  It’s unfortunate that most people who write these articles 1) don’t understand science or research and 2) don’t understand statistics. Unfortunately, many scientists themselves don’t understand statistics, since the vast minority actually have masters degrees in clinical epidemiology.

So, what we get is post that links to a recent epidemiological study and claims that the data supporting cannabis and weight loss “are clear.” In fact, the study you referenced tells us nothing of the sort (despite the author’s claims in the discussion).  The cohort sampled showed a direct overlap between patients who used tobacco and those who used marijuana.  I don’t care if the epidemiologists claim to be able to use fancy statistical methods to control for tobacco use, the fact is that they can’t actually do that.  All this study tells us is that there MAY be an association between cannabis and weight loss, but frankly drawing that conclusion is a stretch.

Maps As Propaganda, Ctd

A reader writes:

I had to laugh when I read your post on maps as propaganda.  I just spent the morning working with a professor to develop a map linking an ancient Islamic map to modern-day features.  You’d think this would be one of the least politically complicated things out there until you have to deal with the area marked for the Basque people. At least the Franks and Saxons aren’t still around …

Another:

I wish I could find a photo, but on the overland border between Guatemala and Belize (the one main highway connecting the two countries in the jungle highlands), on the Guatemala side there was a billboard with a map of their country … which includes the territory of Belize as part of their own (they have a long history of claiming the former British Honduras as their land).

Another writes, “I’ll add this to your list – a map fight between two provinces in a peaceful country!” Another sends the above video and adds, “As someone who works in the field of Geographic Information Systems, I’m really enjoying your series of posts on maps, and it reminds of this scene from The West Wing.” Money quote:

When the top of the map is given to the Northern hemisphere and the bottom is given to the Southern, then people will tend to adopt top and bottom attitudes.

Update from a reader regarding the video:

The unholy result of the evil Mercator Projection is fully realized in the classic game of Risk. Not only does the game board use the outdated projection to award a greater number of territories to the Northern continents, but it also awards armies (when a whole continent is captured) completely irrespective of the actual populations of the continents. This is why I am currently working a version of Risk that uses the vastly superior Dymaxion Map, invented by the great philosopher-inventor Buckminster Fuller. It will rock!

Importing Innovators

Charles Kenny finds evidence that the US has attracted more than its fair share of immigrant innovators:

[Carsten] Fink and his colleague Ernest Miguelez found that in 2010 about 10 percent of inventors worldwide lived outside their country of nationality when making their international patent application. The proportion of international patent applications made from the U.S. by non-nationals was twice as high—around 20 percent. That proportion approximately doubled from 1985 to 2010, and it’s the highest share out of any large economy. It compares with a non-national share of international patent applications of about 2 percent in Japan and closer to 5 percent in Germany and France.

The U.S. is by far the biggest global net beneficiary of innovator migration. Between 2001 and 2010, 14,893 inventors with U.K. nationality applied for international patents while residing in the U.S., for example. And there were three times as many Chinese inventors in the U.S. than British ones. That illustrates the U.S. has done particularly well in attracting innovative talent from the developing world—more than half of the U.S. non-national innovator population comes from countries outside the Organisation for Economic Co-operation and Development club of rich countries.

He goes on to worry about “more and more Indian and Chinese graduates of U.S. universities are returning home rather than dealing with the hassle of American immigration procedures.” Reihan isn’t as concerned.

Our Literary Lies

dish_books

According to Book Riot’s survey of books readers pretend to have read, the chart-toppers are Jane Austen’s Pride and Prejudice and James Joyce’s Ulysses.  Sadie Stein comments:

While the usual lengthy suspects—Ulysses, Moby-Dick, Infinite Jest—are represented, Pride and Prejudice is a surprise dark horse number-one. (Maybe after investing six hours in the BBC miniseries, people feel they’ve got the idea?) Other surprises include the relatively short To Kill a Mockingbird and Great Expectations—perhaps purely due to their inclusion on hundreds of syllabi?—Harry Potter, and, somewhat mysteriously, Fifty Shades of Grey. And this prompts several follow-up questions: When you listen to a book on tape, does that count? Is there a point at which, via osmosis, adaptations, and self-delusion, one can actually begin to believe he has in fact read a book, and is there a German compound word for this phenomenon?

Kerry’s “Fool’s Errand”?

Life Continues In The Havat Gilad, West Bank Outpost

Jeffrey Goldberg believes – surprise! – that Kerry getting Israelis and Palestinians to sit down for fresh negotiations is “a fool’s errand” and that “the collapse of these talks, which is almost inevitable, could have dangerous consequences.” Nevertheless, Goldberg gives Kerry advice:

Kerry is understood in Israel as a true friend; his lobbying could be effective. If the Israelis would take small, unilateral steps on settlements, they could change the Palestinian calculus and improve Israel’s reputation (which has become a genuine national-security concern). On the other side, Kerry might want to try a bit more aggressively to help the Palestinian Authority become a viable governing body with a functioning economy and a bureaucracy that is reasonably free of corruption. Strengthening the Palestinian Authority (and working to weaken Hamas) while cajoling the Israelis to wean themselves from their addiction to settlements are two steps Kerry could take to advance negotiations.

Addiction to settlements? As if it’s some kind of compulsion rather than a long-thought-out, relentlessly implemented strategy for territorial expansion. And how on earth is Netanyahu able to take “incremental steps” when Goldberg himself concedes in the same column that

the Jewish settlement movement on the West Bank is now the most powerful political force in Israel. This is a movement whose leaders and Knesset representatives and cabinet ministers will subvert any peace process that would lead to the dismantling of even a single settlement, including any of the dozens of well-populated ones far beyond Israel’s West Bank security barrier.

As for a viable, much less corrupt governing body on the West Bank, let me simply quote Leon Wieseltier (as slippery as Goldberg on this subject):

Nobody lifted a finger to help Salam Fayyad, who was the Palestinian leader we were all waiting for. No Palestinians and no Israelis. He came and went. It’s a historical scandal of the first magnitude.

(Notice that Wieseltier has to blame the Palestinians as well, for fear he might stumble onto the truth about the settlements and their centrality to the problem.) And yet Goldberg returns to a critique that could have been made in the 1990s. (And Wieseltier, of course, like the entire American Jewish Establishment, was one of those who didn’t lift a finger even on his keyboard when we had a chance for progress five years ago. He preferred to go an an anti-Semite hunt, which is his default position on everything.) Maysoon Zayid notes the deliberately weakened position of the Palestinian Authority:

[President Mahmoud] Abbas, who will decide the fate of the Palestinians if Kerry and the USA have their way, has been a lame duck for the past four years. … Simply put, he is no Yassir Arafat. Unless this agreement on a two-state solution includes a Palestine with the ’67 borders, East Jerusalem as its capital, and addresses water rights as well as the right of return, it will not fly with the average Palestinian on the street or in the camps.

Yuval Diskin, former director of Israel’s Shin Bet, doesn’t sound optimistic:

This is Netanyahu’s moment of truth. He can prove to all of his most vociferous naysayers and critics (me among them) that he is not just a politician passing his—and our—time in the prime minister’s office, but a leader who is capable of grasping the gravity of the situation; a leader capable of freeing himself of his trepidations, fears and secret advisers; a leader capable of understanding the critical need to rise above himself and establish a proper set of priorities; and, most important, a leader capable of shepherding the nation (or, at least a majority of it) to the right path. I have huge doubts as to whether Netanyahu is such a leader, but I will be the first one to praise him if he proves otherwise.

Yeah, right. I suspect Netanyahu would rather ethnically cleanse the West Bank than cede an inch of it. Stephen Walt predicts “a lot of talk, but ultimately no action”:

The Palestinians have nothing left to give up (save for symbolic concessions over the so-called “right to return”), and I can’t see Netanyahu offering them a deal that comes even close to a viable state. And while Kerry’s tenacity is admirable, I’ve yet to see any sign of a genuinely different U.S. approach. Remember: Assorted U.S. diplomats have spent thousands of hours going back and forth with both sides over the years and have ended up with bupkis. So I think we’ll see more talks, along with more settlement building, and ultimately no agreement. And then Obama and Kerry will be gone, and another “opportunity” for peace — if it even is one — will have been lost.

Which is the point, of course. Still, Shibley Telhami thinks peace talks are more necessary now than ever:

[T]he conflict remains the prism of pain through which Arabs view Washington and much of the world — even more so since the region’s uprisings. In October 2011, when I asked Arabs in Morocco, Egypt, Saudi Arabia, Jordan, Lebanon, and the UAE what two steps the United States could do to improve their view of Washington, 55 percent of respondents said “brokering Israeli-Palestinian peace” based on the 1967 borders, with 42 percent choosing “stopping aid to Israel” as the second step. In comparison, only 12 percent suggested providing more economic aid to the region, and 11 percent proposed greater efforts at democratization. In a 2012 poll in Egypt, 66 percent identified brokering peace followed by 46 percent who recommended stopping aid to Israel; only 12 percent suggested that Washington do more to spread democracy.

(Photo: A Jewish settler boy swims in a pool on July 22, 2013 near the Jewish outpost Settlement of Har Bracha, West Bank. By Uriel Sinai/Getty Images)