Ben Blatt illustrates the country’s linguistic diversity with a map of the second- and third-most spoken tongues in across America (Spanish is the second-most common language in 43 of the 50 states):
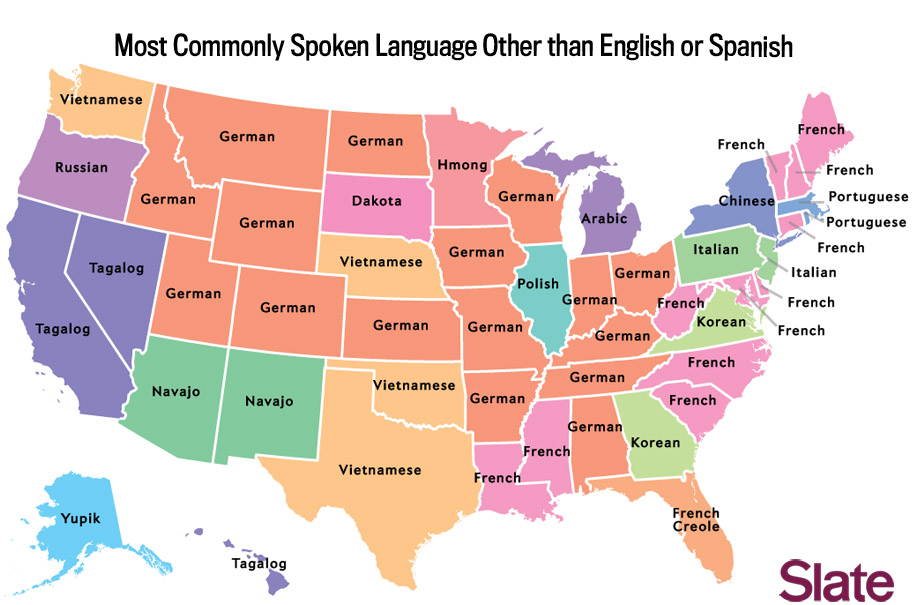
Ben Blatt illustrates the country’s linguistic diversity with a map of the second- and third-most spoken tongues in across America (Spanish is the second-most common language in 43 of the 50 states):
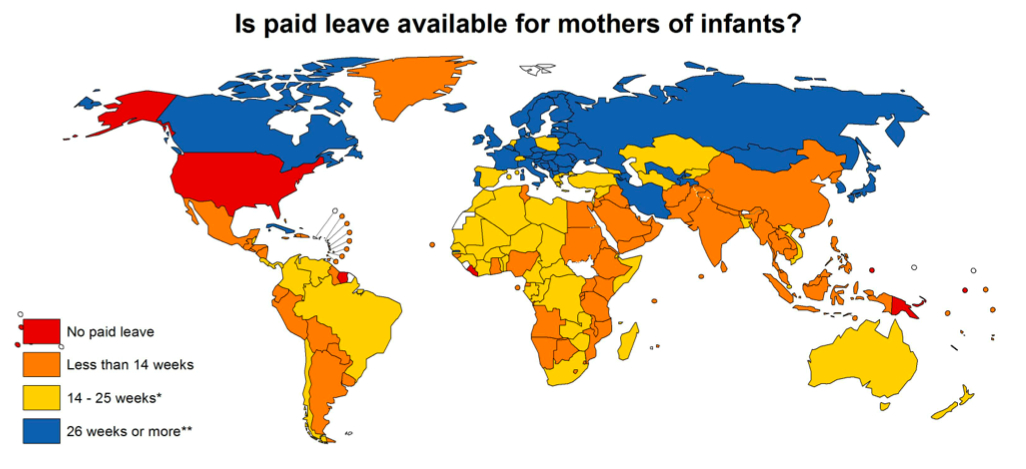
Lest we be too pleased with ourselves for remembering to call mom on Sunday, Ezra reminds us how tough it is for working mothers in the US, who have no guarantees of paid time off to care for an infant or a sick child:
While a handful of states, like California, offer modest paid maternal leave, there’s no federal guarantee of either paid maternal or paternal leave. We make mothers choose between spending a month with their newborn child or keeping a roof over their child’s head. That’s not how it looks in countries that value the work mothers do.
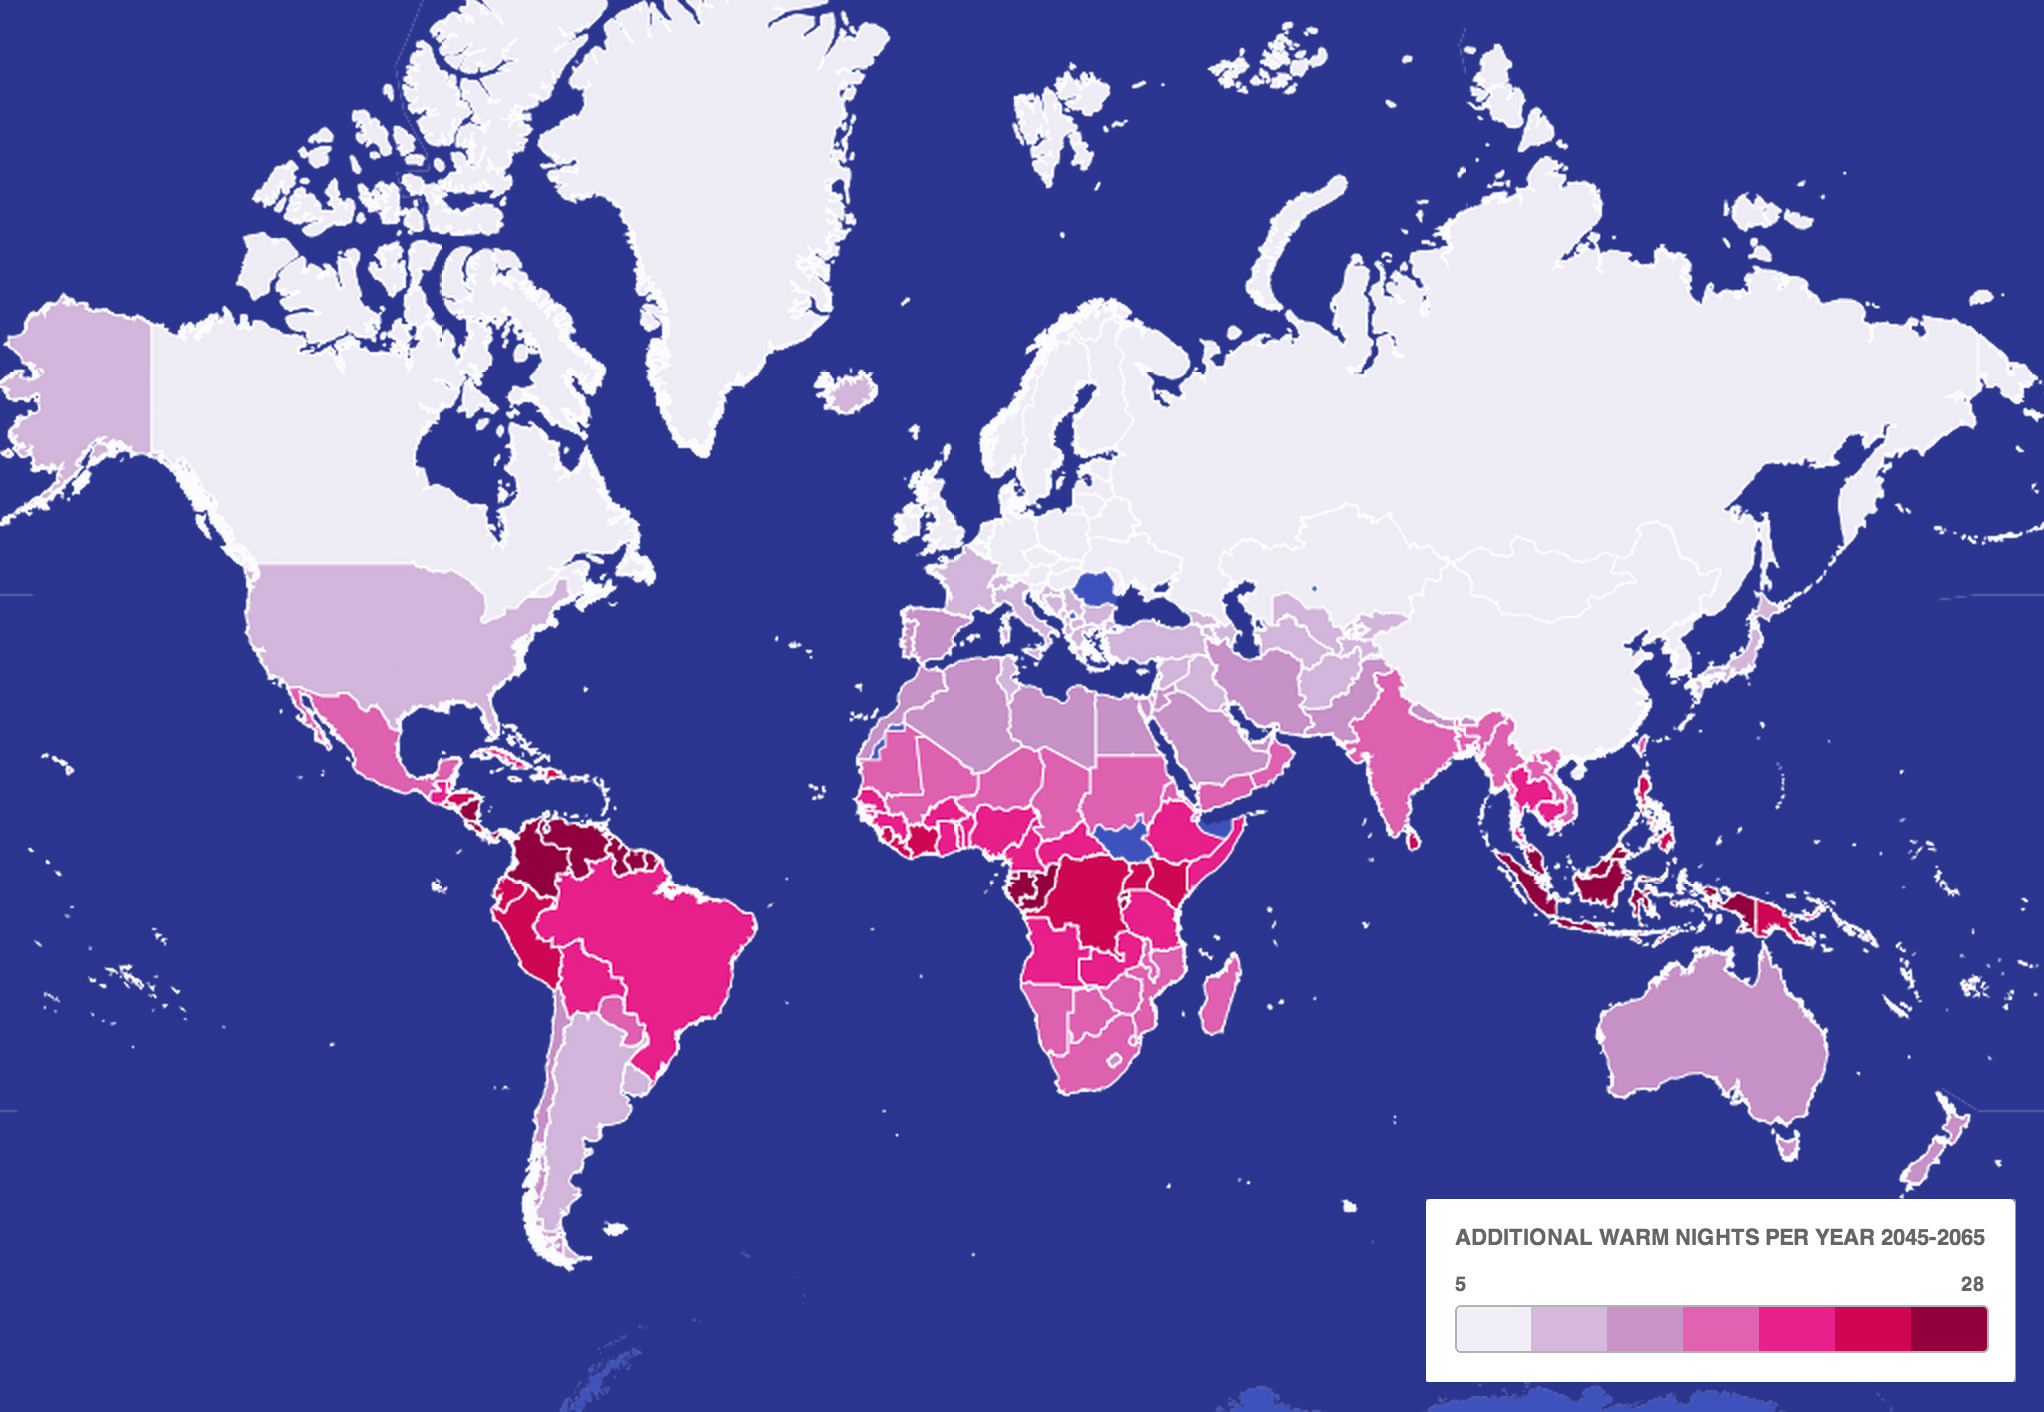
Tim De Chant explains:
Worldwide, [climate change will lead to] somewhere around two weeks of higher nighttime low temperatures. In some places, winter nights may be unseasonable warm, or in others summer nights could grow more sweltering and sleepless.
But it’s not just our comfort that’s at stake. Plants are uniquely sensitive to nighttime low temperatures. If they’re too high, plant respiration rates tend to increase. (Yes, plants respire just like us. Unlike us, they’re able to grow without eating because, during a typical day, the rate of photosynthesis greatly outpaces the rate of respiration, meaning they’re making more food than they are consuming.) When respiration rates rise in plants, they consume more of the carbohydrates they made through photosynthesis during the day. With less energy available, they might grow more slowly or put less energy into producing seeds. It happens that many staple crops, like rice and corn, are seeds, so warm nights are one way climate change could slash crop harvests.
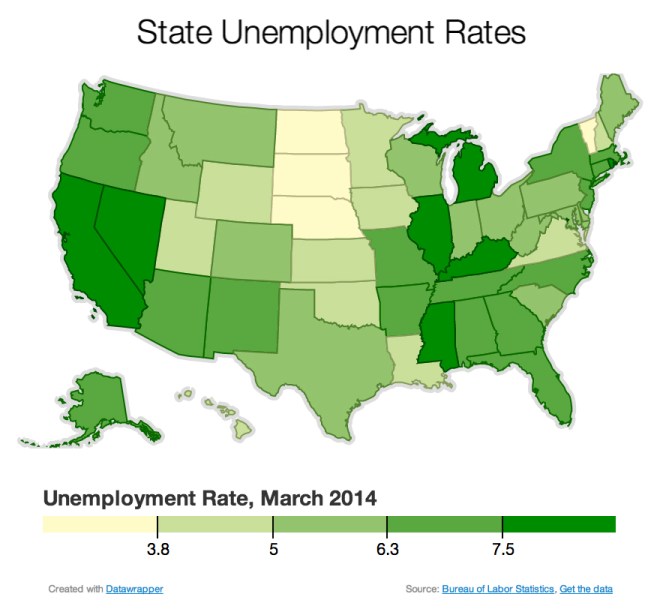
Danny Vinik relays a way to even out those unemployment rates:
One idea economists have suggested to help the long-term unemployed—that is, those out of work more than six months—is to offer them financial assistance to move to some of these states and areas with low unemployment. This would create a more flexible labor market and allow unemployed workers, particularly the long-term unemployed, to move to areas where there are fewer job seekers.
Not everyone can move to North Dakota and find a job of course. The labor market is small there and an influx of long-term unemployed workers would send the state’s unemployment rate skyrocketing. But it could help on the margins. Given the magnitude of the crisis of the long-term unemployed, it’s worth a shot.
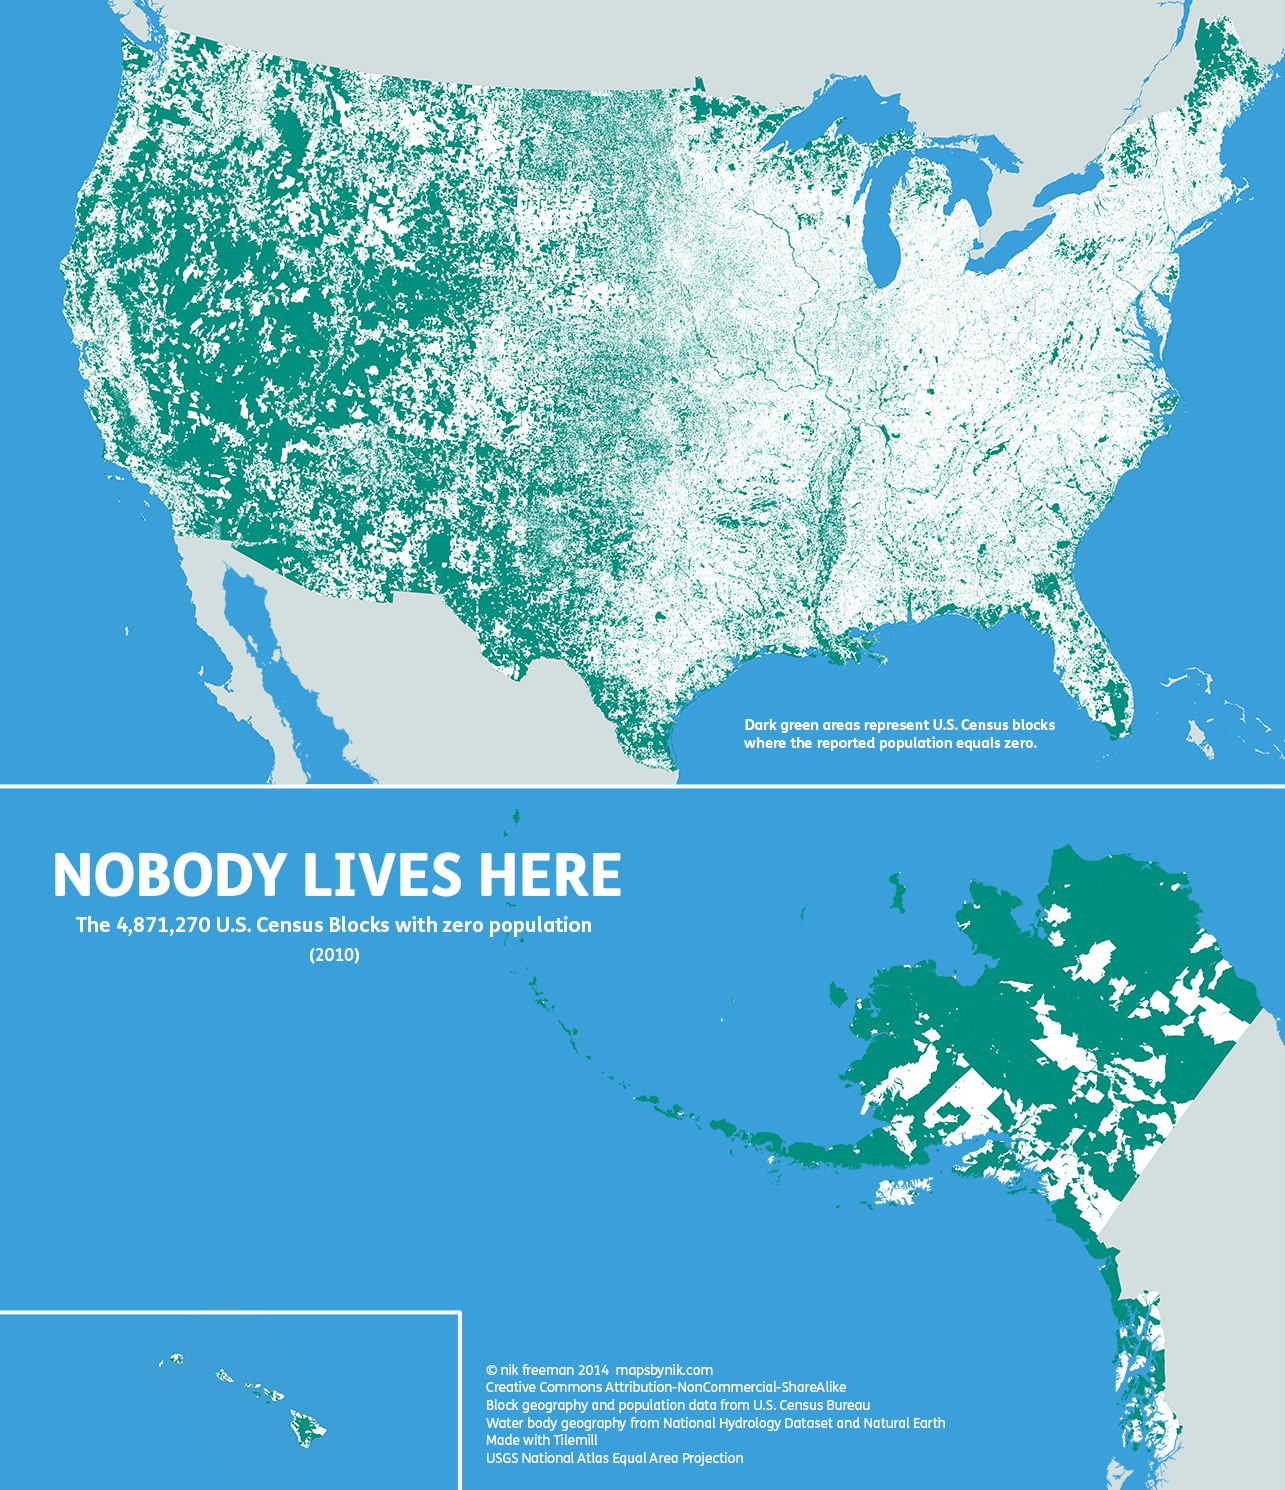
Nik Freeman maps America’s empty space:
As of the 2010 census, the United States consists of 11,078,300 Census Blocks. Of them, 4,871,270 blocks totaling 4.61 million square kilometers were reported to have no population living inside them. Despite having a population of more than 310 million people, 47 percent of the USA remains unoccupied. Green shading indicates unoccupied Census Blocks. A single inhabitant is enough to omit a block from shading.
Canada is more dramatic.
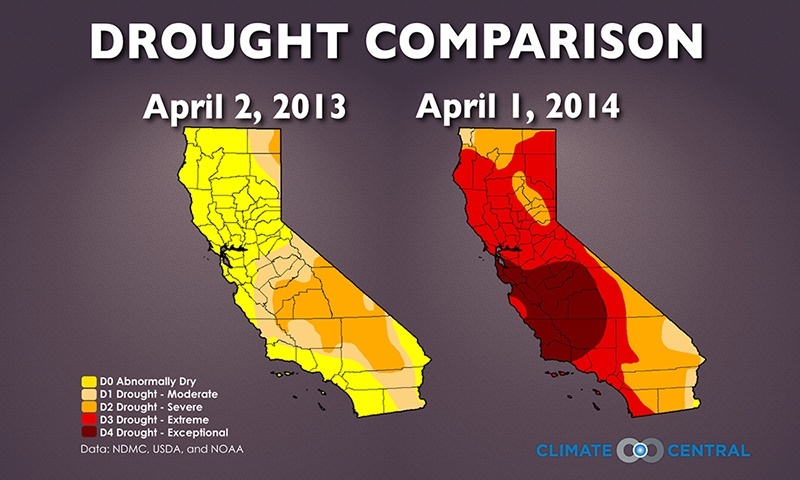
California’s epic drought hasn’t let up:
Nearly the entire Golden State – 99.81 percent to be exact — is in the grip of drought, according to the latest update from the U.S. Drought Monitor. Nearly 70 percent of the state is suffering from an “extreme” or “exceptional” drought, the two highest categories on the Monitor’s rating scale. The snowpack across the entire state is at a measly 35 percent of its normal level, according to figures released Monday, and water systems and residents are feeling the strain.
The drought has been building in California for the past three years, though it reached its worst point after this winter wet season failed to live up to its name. At this point last year, only a quarter of the state was in drought conditions; now, that much of the state is in exceptional drought alone — marking the first time the Monitor has used that rating in California since it’s inception in 1999, said one of the Monitor’s authors, Mark Svoboda, a climatologist with the National Drought Mitigation Center(NDMC) at the University of Nebraska-Lincoln.
Nathan Yau passes along a timelapse that animates centuries of European border changes – set to the music from Inception. The result is quality infotainment:
For more, check out The Centennia Historical Atlas. Update from a reader:
Nice map, but full of mistakes. One such: Yugoslavia shown as an entity in 1910. In 1910 it would be the Kingdom of Serbs, Croats and Slovenes and still not officially recognized. The Kingdom of Yugoslavia is 1929. Federal Yugoslavia (the one everyone knows, which disintegrated in 1990) was a post-WWI creation. That is not a big difference in the major scheme of things, but still.
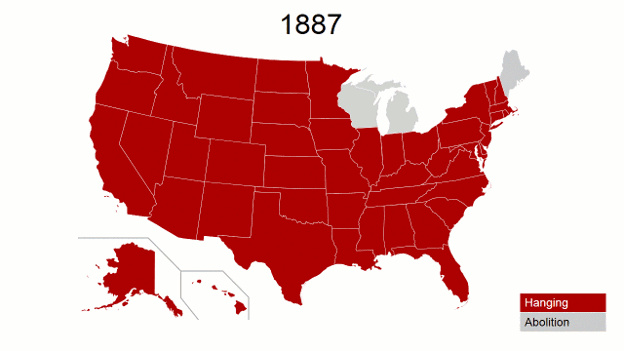
Lane Florsheim details the evolution of executions in the US:
In 1790, Thomas Bird became the first person to be executed under the United States Constitution. Bird was convicted of murder and piracy, and the total cost of his hanging was five dollars and fifty cents (for the construction of a gallows and a coffin). Since then, the U.S. state and federal governments have executed thousands of people by hanging, firing squad, electric chair, lethal gas, and lethal injection. The map [seen above] illustrates the progression of death penalty execution methods by state since the beginning in the late nineteenth century.
The Supreme Court effectively put executions on hiatus in its 1972 Furman v. Georgia decision, but states immediately began working around the ruling and the Court reinstated the death penalty in 1976’s Gregg v. Georgia decision. By 2009, all death-penalty states had made lethal injection the sole or primary execution method for death row inmates, despite problems with the method that have been evident since the 1950s. Now, the death penalty is transforming once again, due to a shortage in the drug used in the three-drug protocol to paralyze the inmate during his execution. As a result, states have resorted to hunting for a replacement in unusual places, such as domestic compounding pharmacies. Some have changed their protocols to use just one drug, or tried to replace the missing drug with new drugs. Others have put executions on hold. In states such as Louisiana, Tennessee, and Wyoming, there’s even been talk of reintroducing the electric chair. This has led to a spate of ethical problems and legal challenges.
Previous Dish on the shortage of lethal-injection drugs here.
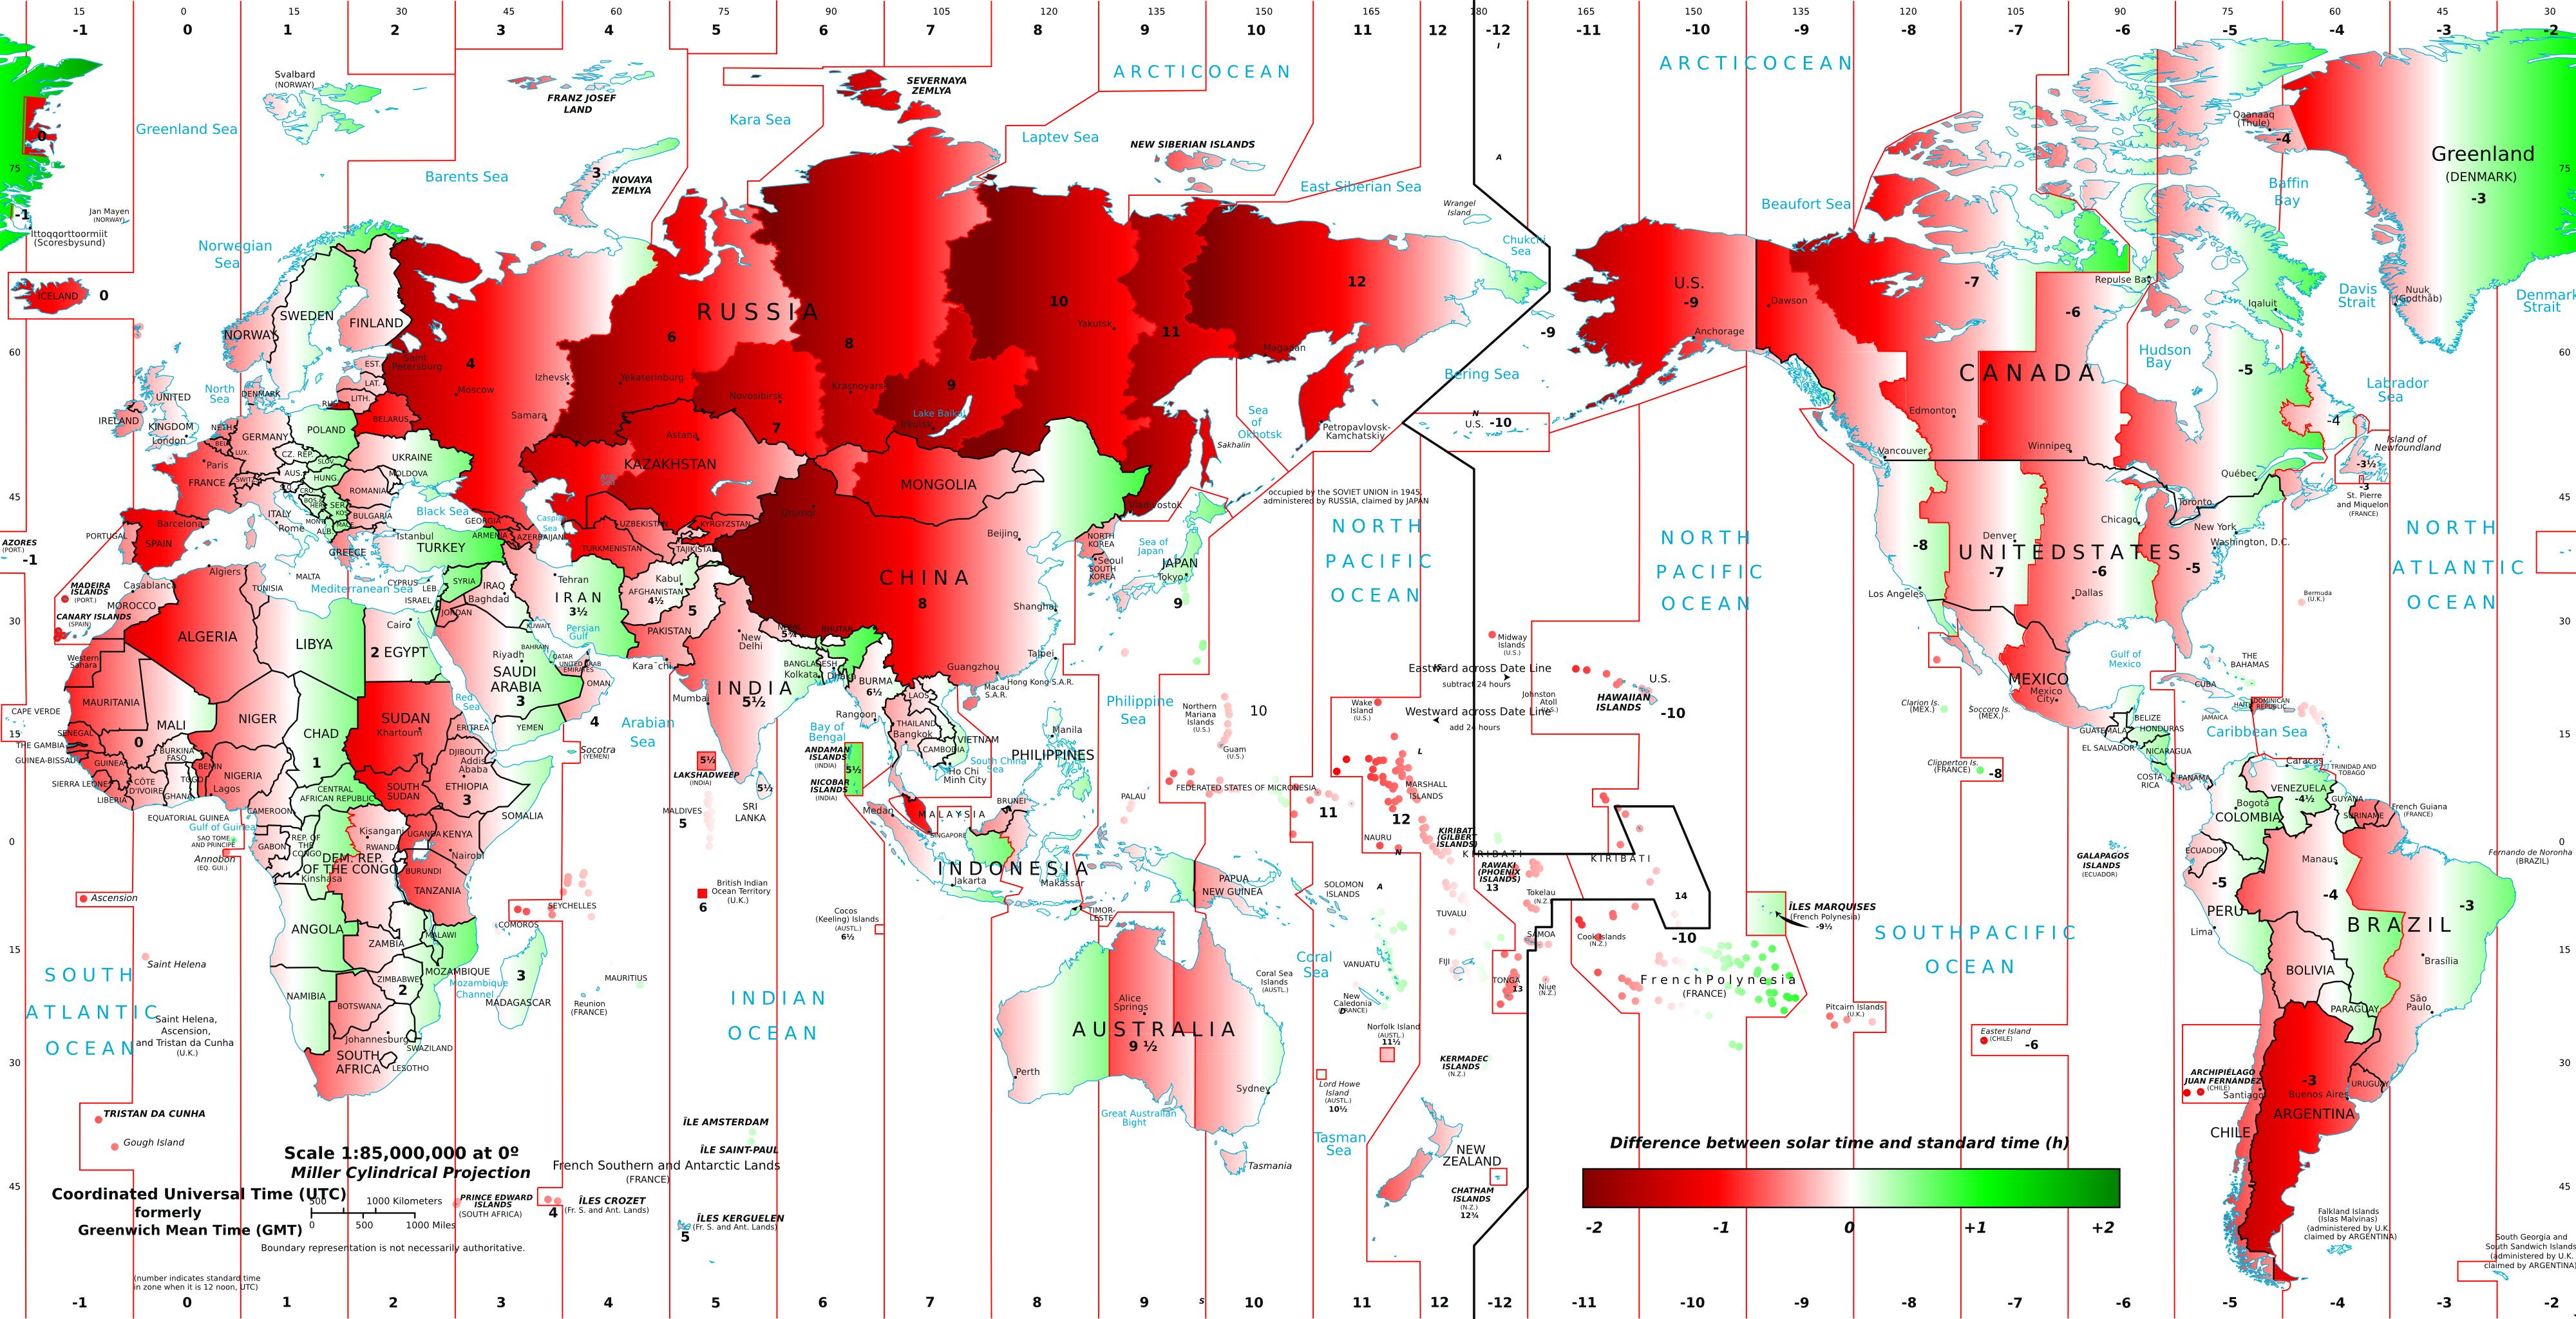
Keating passes along a timezone map:
The map above, created by math blogger and Google engineer Stefano Maggiolo (click here for a full-size version), shows the difference between clock time and “solar time”—a schedule in which the sun is at its highest point in the sky at exactly 12 noon.
For whatever reason, more of the world seems to be a little bit like Spain—the sun rises and sets later in the day than it should—than the other way around. The “late” places are shown in red, the “early” places in green. The deeper the shade, the more off the time is.
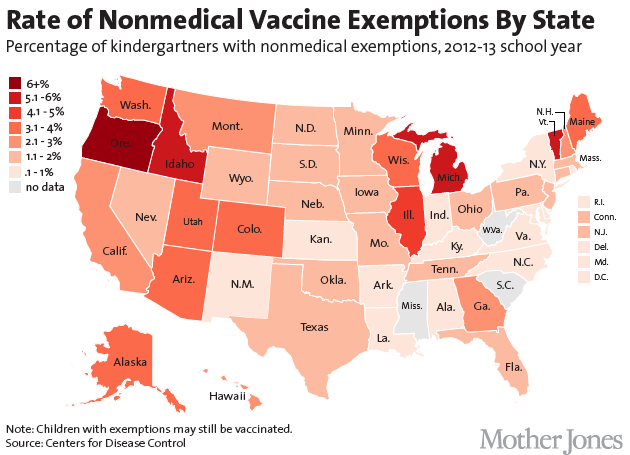
Tasneem Raja and Chris Mooney compare state-by-state data on vaccine exemptions:
There’s evidence that tightening exemption laws makes a difference. After reaching an exemption rate of 7.6 percent in 2009, Washington state passed a law requiring parents to get a doctor’s signature if they wanted to opt out of their children’s vaccinations. In just two years, the exemption rate plummeted by more than 40 percent. Pertussis vaccination ratesclimbed to 92.4 percent in the past school year, representing “the highest pertussis vaccine completion rate for kindergartners since the state began to collect this data in the 2006-2007 school year,” according to the Washington’s Department of Health.
Razib Khan examines the data for patterns:
[R]ather than a standard Left-Right axis, I think we’re seeing a “crunchy counter-culture” sentiment.
