Below are the finalists we’ve selected for the Map Of The Year, please review them and then vote for your favorite at the bottom of the page.
1) World Timezones:
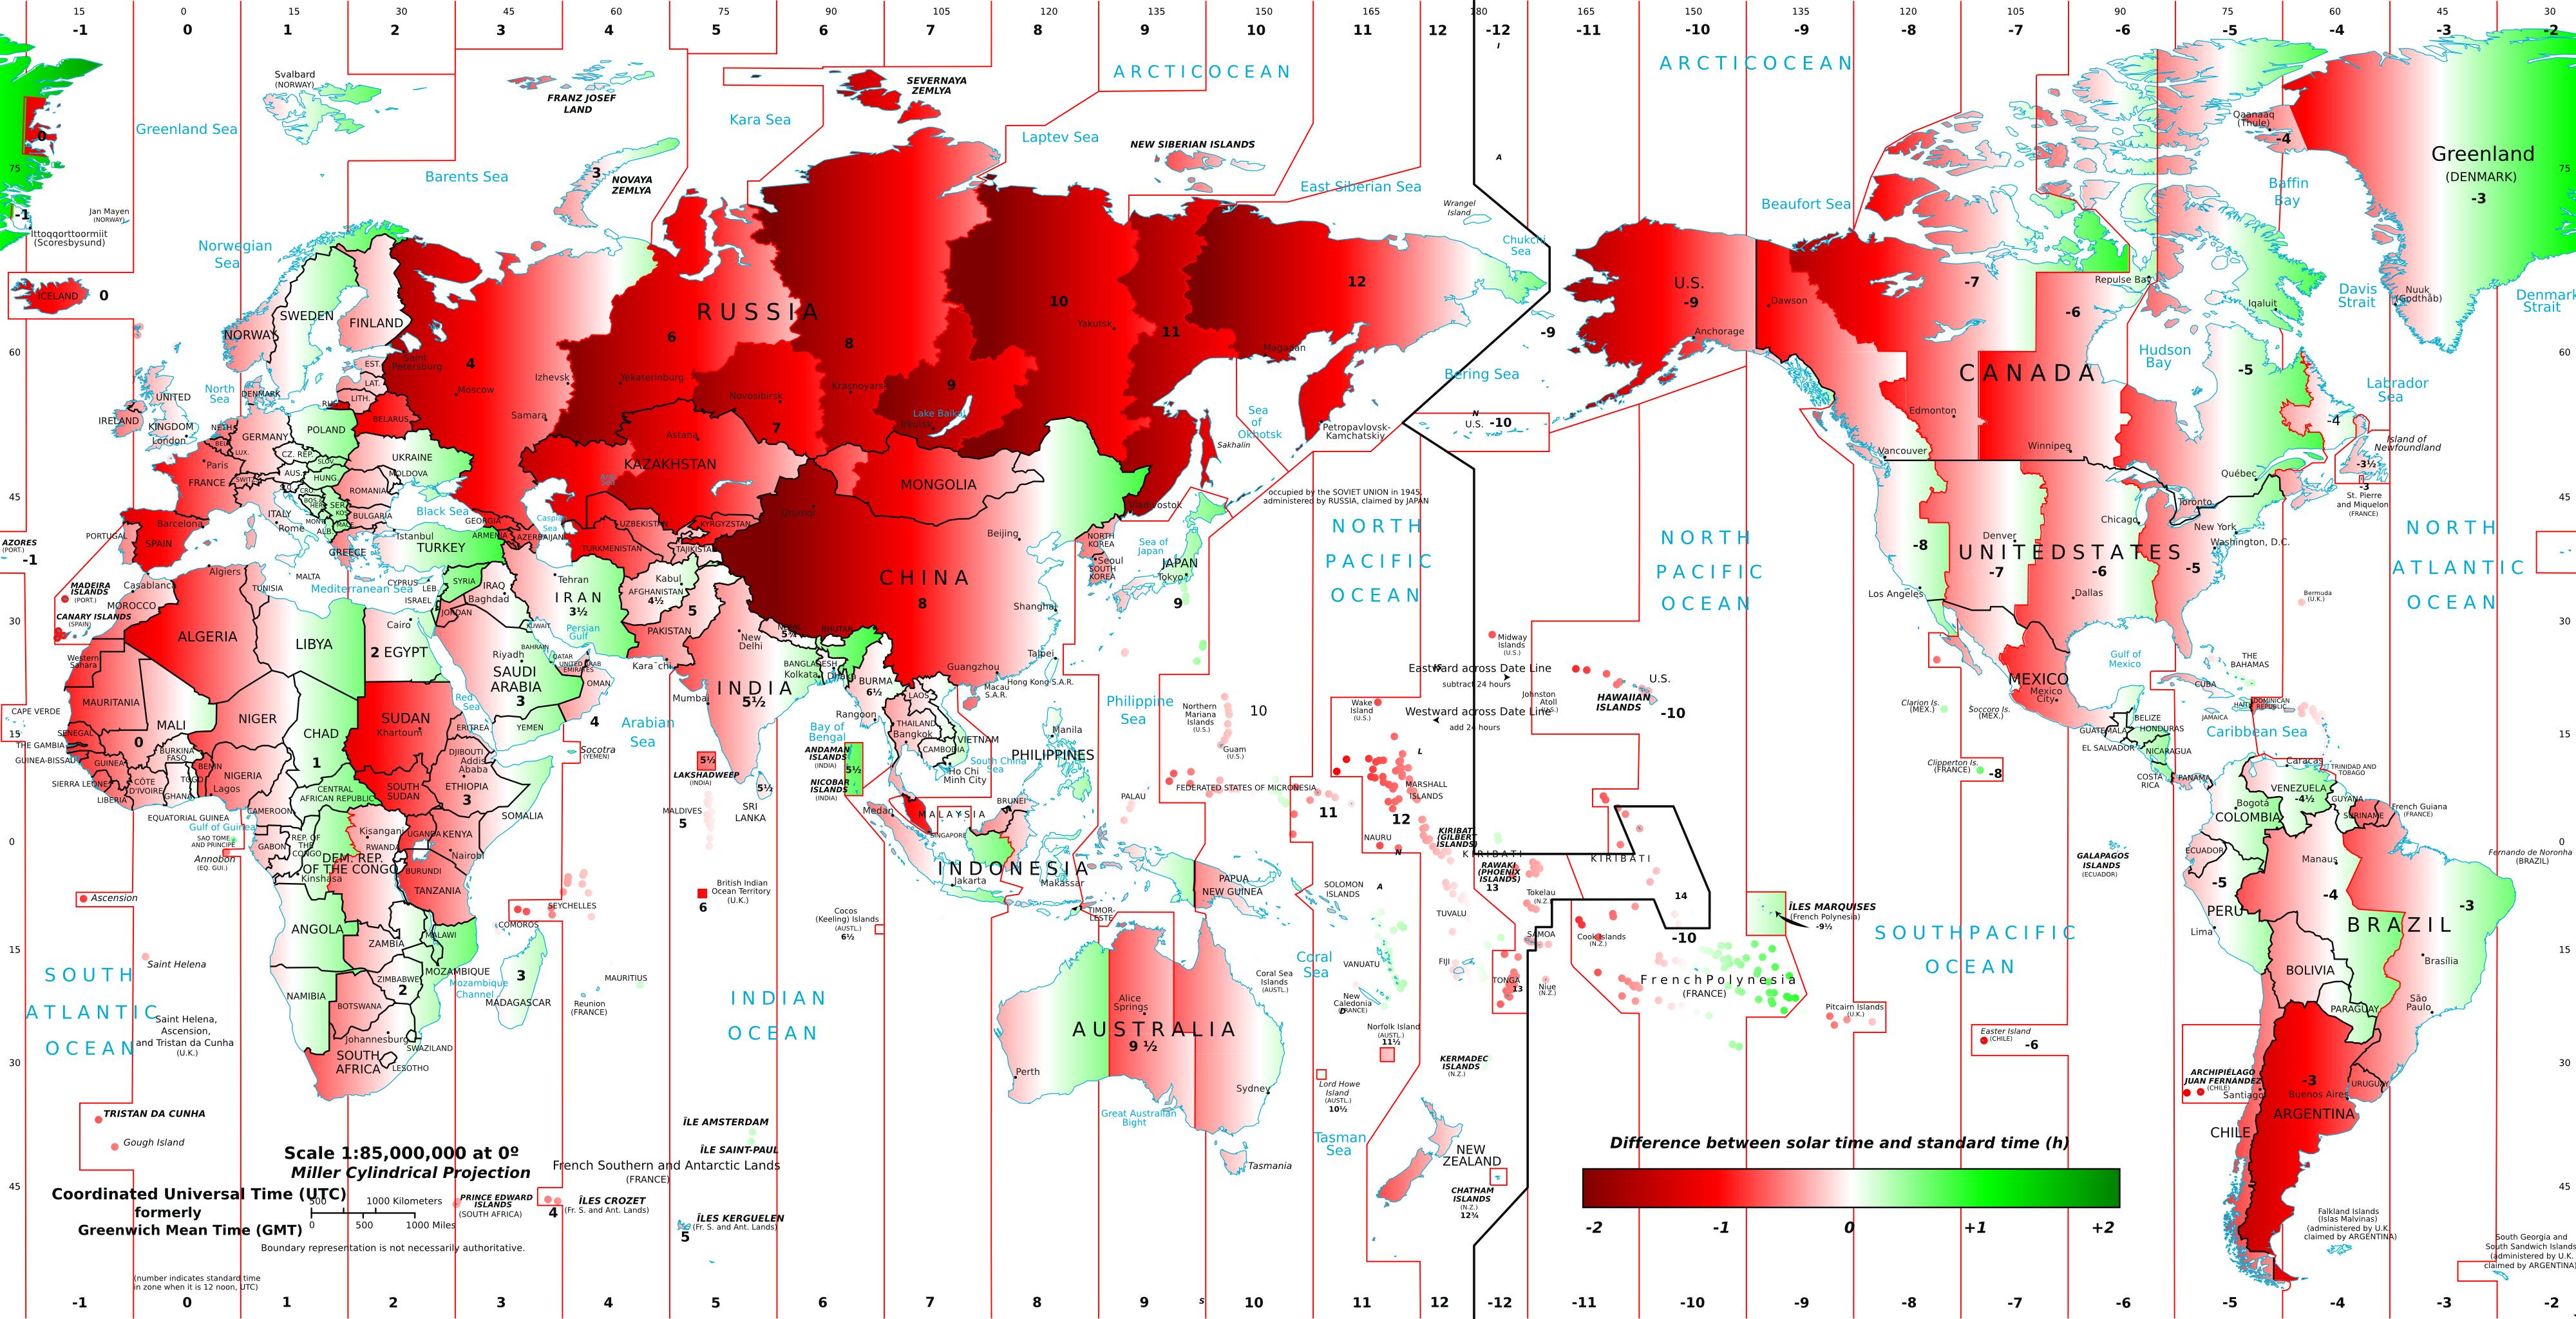
Keating passes along a timezone map:
The map above, created by math blogger and Google engineer Stefano Maggiolo (click here for a full-size version), shows the difference between clock time and “solar time”—a schedule in which the sun is at its highest point in the sky at exactly 12 noon.
For whatever reason, more of the world seems to be a little bit like Spain—the sun rises and sets later in the day than it should—than the other way around. The “late” places are shown in red, the “early” places in green. The deeper the shade, the more off the time is.
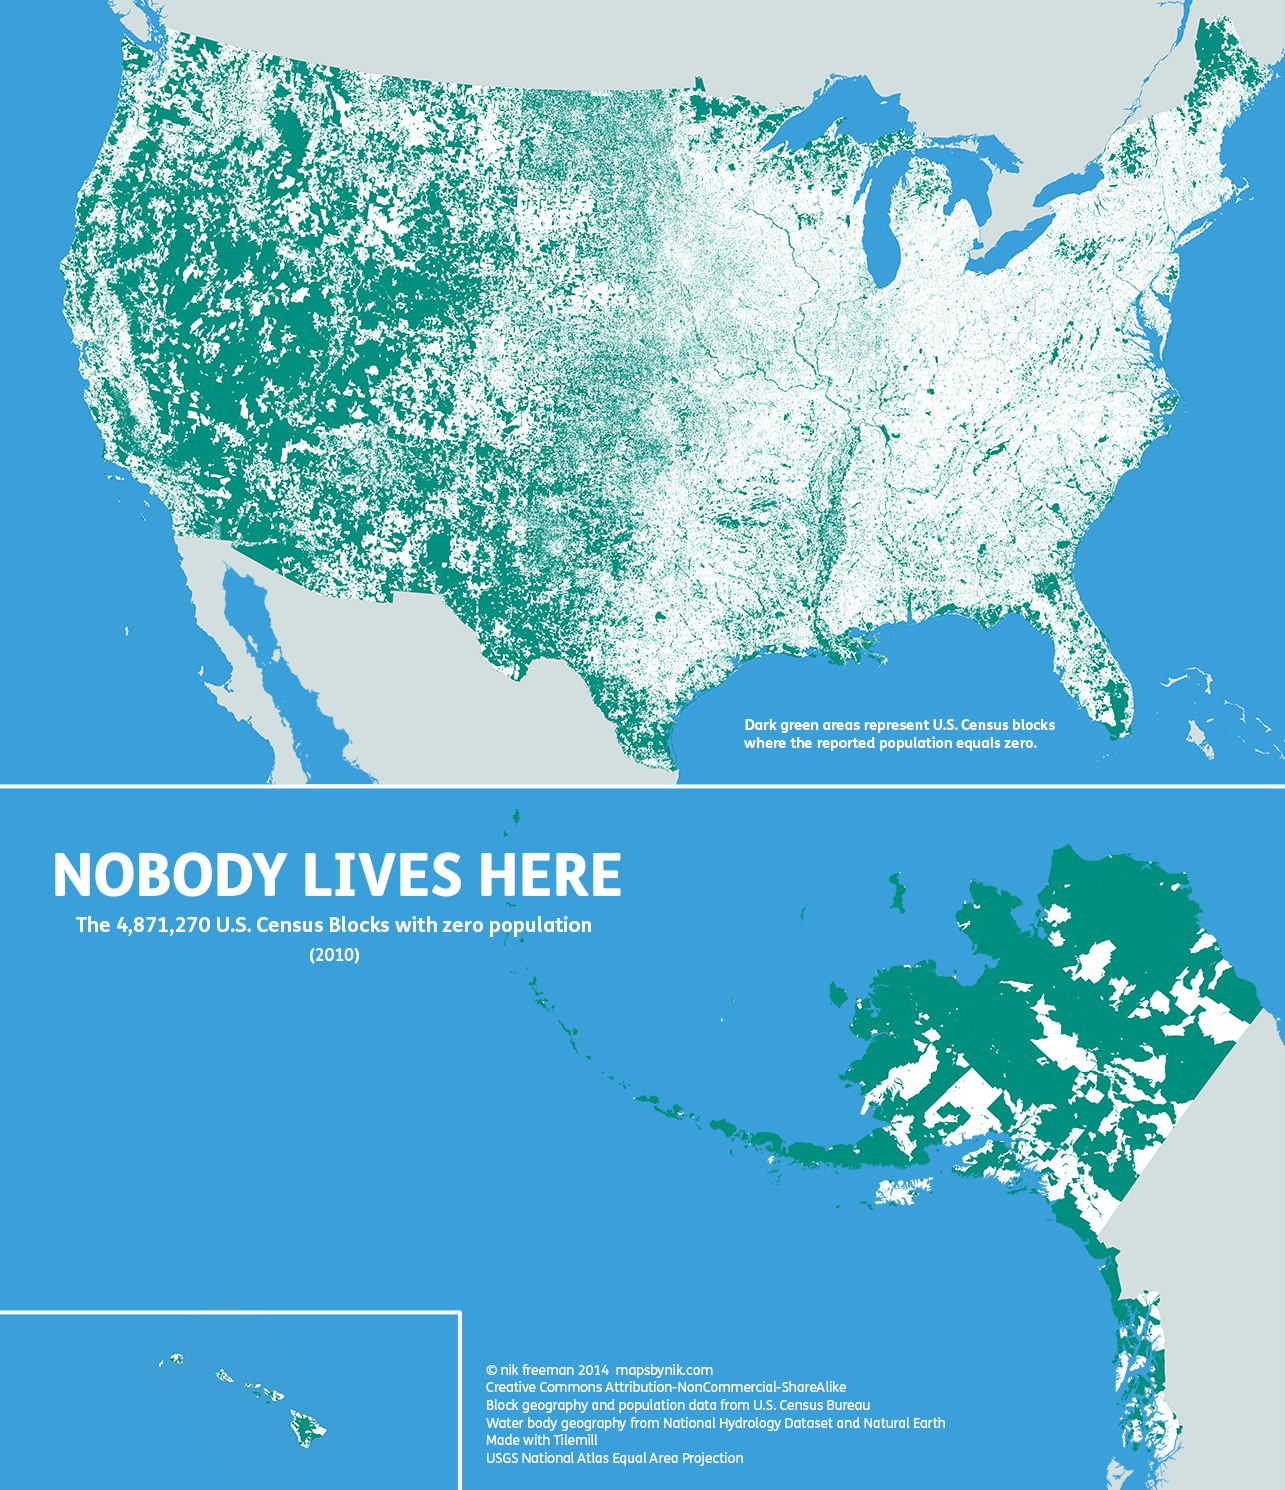
Nik Freeman maps America’s empty space:
As of the 2010 census, the United States consists of 11,078,300 Census Blocks. Of them, 4,871,270 blocks totaling 4.61 million square kilometers were reported to have no population living inside them. Despite having a population of more than 310 million people, 47 percent of the USA remains unoccupied. Green shading indicates unoccupied Census Blocks. A single inhabitant is enough to omit a block from shading.
Canada is more dramatic.
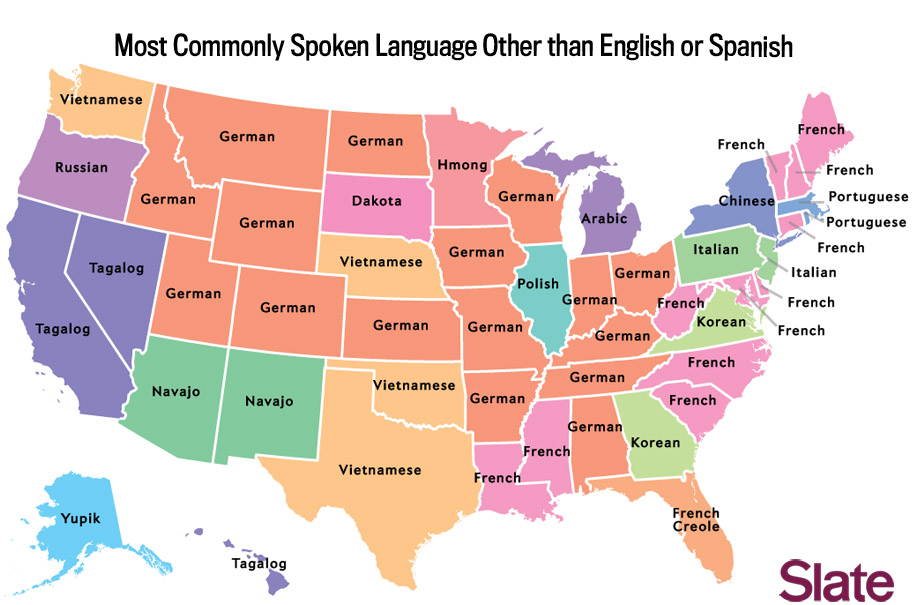
3) The United States of Second Languages:
Ben Blatt illustrates the country’s linguistic diversity with a map of the second- and third-most spoken tongues in across America (Spanish is the second-most common language in 43 of the 50 states):
4) The Rise of ISIS:

Armin Rosen explains ISIS’s expanding grip on Iraq and Syria:
ISIS operates across a vast geographic area. Jalula, Iraq, the easternmost population center under ISIS’s control, is over 360 miles from Raqqah, Syria, the group’s westernmost zone of control. ISIS sprawls across the Iraqi-Syrian border. It’s attacked inside of Iraqi Kurdistan, sits at the doorstep of Syria’s Alawaite heartland, and has broad operational abilities inside Iraq’s Sunni Triangle, and even its Shi’ite south. ISIS cuts across ethnic and sectarian regions, controlling major cities and desert wilderness.
In analyst Shiraz Maher’s view, ISIS controls more territory than the governments of Israel and Lebanon. It controls nearly a third of Iraq alone, according to the Long War Journal.
5) America’s First Political Map:
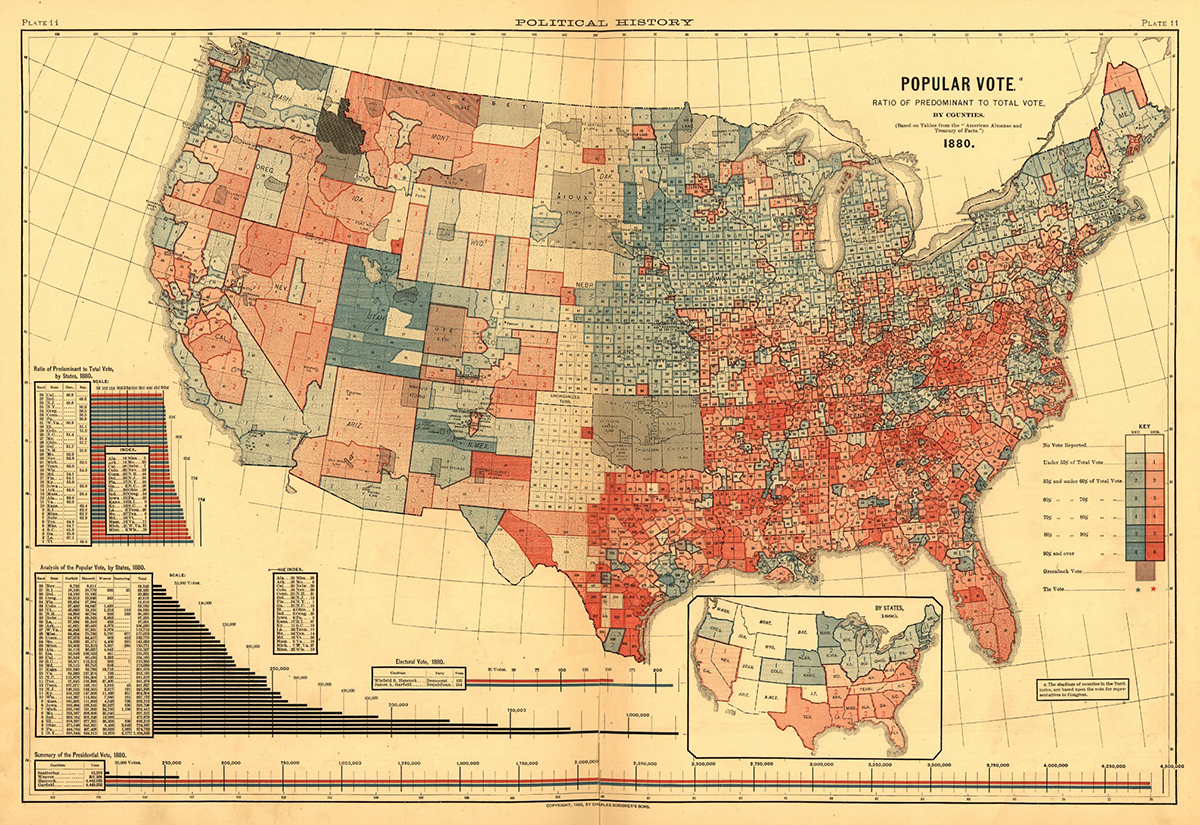
While flipping through “Scribner’s Statistical Atlas of the United States,” first published in 1883, Susan Schulten marvels at the above map from 1880, “the first American attempt to map the outcome of an election”:
The Popular Vote map was the creation of Henry Gannett, superintendent of the census and future president of the National Geographic Society. It was the first map to use shading techniques to visualise American political behaviour. I was struck by the spatial patterns: the dense chequerboard of eastern counties contrasting sharply with the open crazy-quilt patchwork out West. Then my eye was drawn to the patterns of colour in the eastern states. Just as now, red and blue were used to show which party had prevailed in each county.
The map even looked a little like the 2012 electoral picture, with a preponderance of blue through what we now regard as the Democratic stronghold of the north-east, and red spilling across the Republican South. It took a minute to see that the colours were reversed: here red represents the Democrats and blue the Republicans. So while the map looks familiar, the political landscape has flipped. … [I]t was not until the election of 2000 that NBC’s “Today” show indelibly fixed the colours of American politics: red for the Republicans and blue for the Democrats.
Update from a reader:
I find it fascinating that Utah is one of the only locations that has completely switched (or didn’t switch, depending how you look at it). It’s an interesting artifact of Mormon history and the change of it’s theology and relationship to American culture.
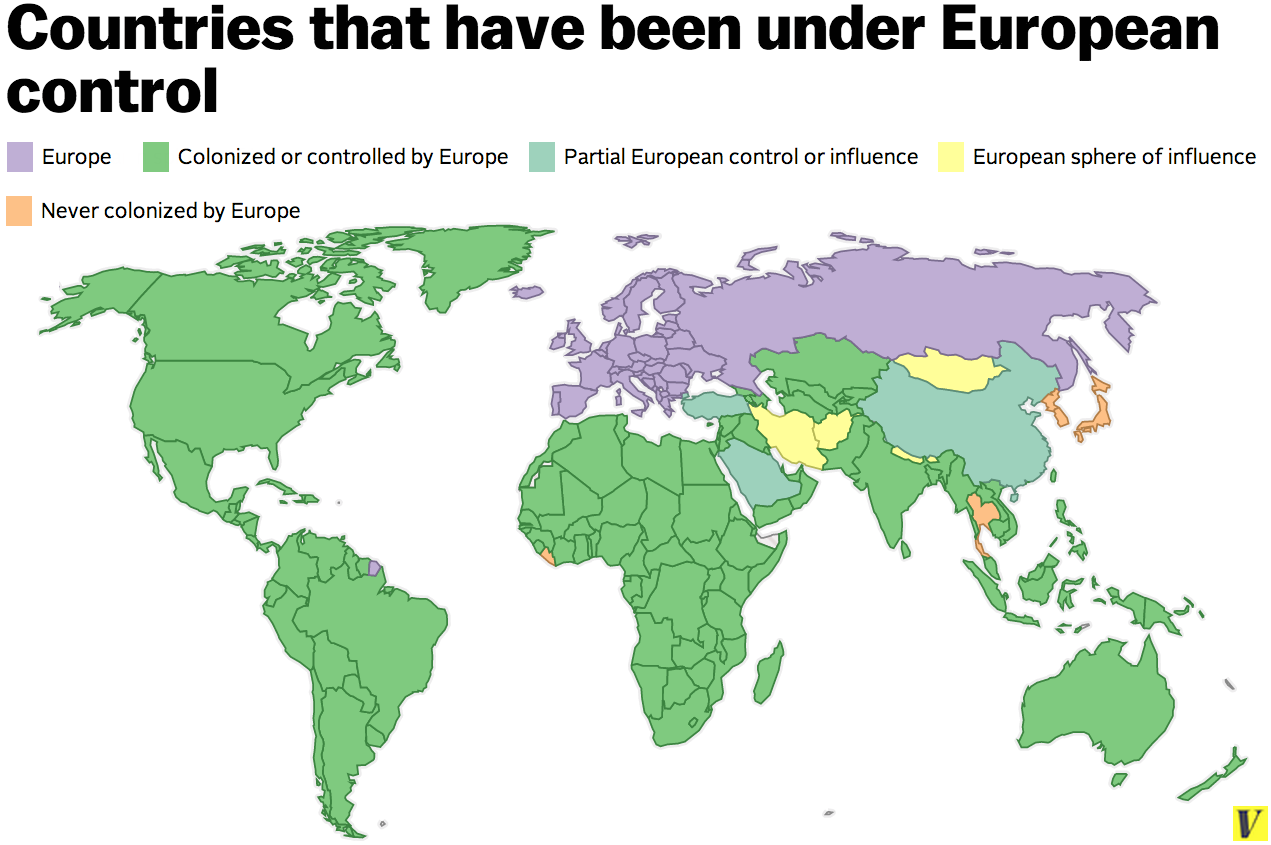
Max Fisher captions:
There are only four countries that escaped European colonialism completely. Japan and Korea successfully staved off European domination, in part due to their strength and diplomacy, their isolationist policies, and perhaps their distance. Thailand was spared when the British and French Empires decided to let it remained independent as a buffer between British-controlled Burma and French Indochina. Japan, however, colonized both Korea and Thailand itself during its early-20th-century imperial period.
Then there is Liberia, which European powers spared because the United States backed the Liberian state, which was established in the early 1800s by freed American slaves who had decided to move to Africa. The Liberian project was fraught — the Americans who moved there ruled as a privileged minority, and the US and European powers shipped former slaves there rather than actually account for their enslavement — but it escaped European domination.
7) The Tweet Polarization of the Gaza War:
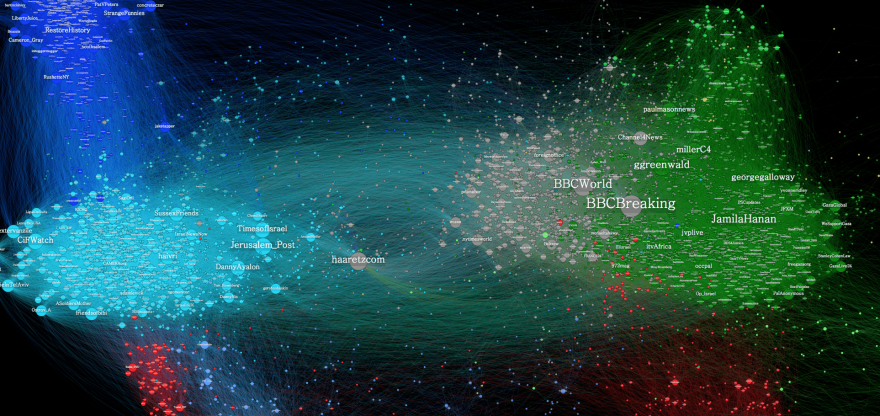
Gideon Lichfield captions the above image, which “depicts Twitter accounts that tweeted about the Israeli shelling of a UN school in Beit Hanoun on July 24th”:
The Twitter accounts are arranged according to how many connections they share; the closer two accounts are, the more accounts they both follow. The bigger the circle, the more followers that account has. What emerges from this is distinct groupings: “pro-Palestinian” in green on the right; “pro-Israel” in blue on the left. Lotan has colored most of the international journalists and media outlets in gray; they clearly have more followers among the pro-Palestinian side. The dark blue group in the upper left are American conservatives and Tea-Party types, while the lighter blue are Israeli media outlets and blogs, and American Zionist figures.
The standout here is Ha’aretz, the left-wing Israeli newspaper. While closer to the pro-Israel side, it clearly has a lot of pro-Palestinian followers. It’s fair to say that readers of Ha’aretz’s English edition include the only groups of people from the two sides who are reading the same news.

Amanda Taub highlights the work data journos at The Guardian have been doing with Wikileaks’ Iraq War logs. Each red dot on the above map – the screenshot seen above only shows one corner of Baghdad, but the project covers the whole country – represents one of some 60,000 combat-related fatal incidents (mostly IEDs) between 2004 and 2009, representing more than 100,000 deaths. And that’s not even the whole story, as Taub points out:
[T]he true extent of the violence is much worse: the map likely only shows a small fraction of the attacks from that period. The database the map is drawn from does not include deaths from criminal activity, or those that were initiated by Coalition or Iraqi forces. And many deaths may not have been officially tallied. That means that the real total is almost certainly much higher. But even seeing the number of attacks recorded here shows how devastating this war has been to Baghdad’s civilians, who must now face even more attacks.
Vote Here:
Browse our Map of the Day archive here. Polls will close on Wednesday, December 31, at midnight. Winners will be announced soon after. Be sure to vote for the rest of our 2014 awards below:
- Beard Of The Year
- Chart Of The Year
- Cool Ad Of The Year
- Face Of The Year
- Hathos Alert Of The Year
- 2014 Malkin Award
- Mental Health Break Of The Year
- Poseur Alert Of The Year
- Window View Of The Year
- 2014 Yglesias Award
Please note: due to there not being enough nominees this year, we will not be issuing a 2014 Hewitt Award, Moore Award, or Dick Morris Award. Learn more about all our awards here.
